GOLD weekly special report based on 1.00 Lot Calculation:
TECHNICAL ANALYSIS:
- SUPPORT AREA BETWEEN $3,300 AND $3,200: Gold prices have seen near-term support at $3,300, and an extended support level at $3,200, meaning the area between $3,300 and $3,200 altogether acts as a near-term support area.
- DAILY MOVING AVERAGES POINT TO AN UPTREND: Gold prices have managed to stay above the 50- and 100-day moving Averages, pointing to an ongoing uptrend. However, gold prices can also change their trend if prices fall below the 50- and 100-day moving averages.
- MID–TERM UPTREND: As depicted by the daily chart below, the gold price has kept trading above the mid-term dark blue-lined uptrend channel, confirming its mid-term trend is up. However, there remains a risk of a potential breakout below this level if market conditions change.
- GOLD HIT A NEW ALL-TIME HIGH OF $3,499.76 (April 22, 2025): Gold has traded around $3,322, and if a full recovery takes place, the price of Gold could rise around $180. Although the price could decline as well.
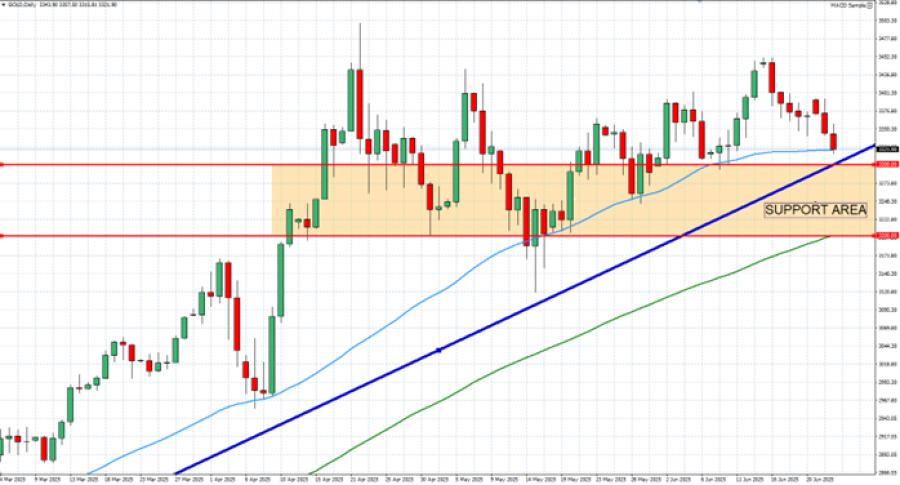
GRAPH (Daily): March 2025 – June 2025
Please note that past performance does not guarantee future results
GEOPOLITICS: ISRAEL – IRAN CONFLICT
- ISRAEL – IRAN CONFLICT: This Middle – Eastern conflict is supportive for the price of Gold as geopolitical instability supports safe – haven demand for Gold.
- June 13: Israel launches operation Rising Lion, hitting dozens of Iranian military and nuclear facilities.
- June 13: Iran retaliates immediately with over 150 ballistic missiles and 100+ drones.
- June 21: The United States becomes directly involved in the conflict on the side of Israel, targeting the same nuclear facilities with more powerful ordinance. Iran continues its retaliation towards Israel.
- June 23: Iran targets a US base in Qatar with airstrikes.
EVENTS:
- TUESDAY, JUNE 24 AND WEDNESDAY, JUNE 25 AT 15:00 GMT+1: FEDERAL RESERVE CHAIR JEROME POWELL TESTIMONY BEFORE U.S. CONGRESS. Any statements concerning interest rate cuts by the end of 2025 could influence the price of gold. According to Bloomberg, Federal Reserve Chair Jerome Powell will deliver his semi-annual testimony to the Joint Economic Committee on June 24 and June 25.
ANALYSTS’ OPINION:
- CITIGROUP has a price target of $3,500
- J.P. MORGAN has a price target of $3,675.
- GOLDMAN SACHS has a price target of $3,700.
- UBS has a price target of $3,500.
Source: Reuters, Bloomberg, CNBC
GOLD, June 24, 2025
Current Price: 3,322
|
GOLD |
Weekly |
|
Trend direction |
|
|
3,500 |
|
|
3,450 |
|
|
3,400 |
|
|
3,250 |
|
|
3,240 |
|
|
3,220 |
Example of calculation base on weekly trend direction for 1.00 Lot1
|
GOLD |
||||||
|
Pivot Points |
||||||
|
Profit or loss in $ |
17,800 |
12,800 |
7,800 |
-7,200 |
-8,200 |
-10,200 |
|
Profit or loss in €2 |
15,331 |
11,024 |
6,718 |
-6,201 |
-7,063 |
-8,785 |
|
Profit or loss in £2 |
13,075 |
9,402 |
5,729 |
-5,289 |
-6,023 |
-7,492 |
|
Profit or loss in C$2 |
24,403 |
17,548 |
10,694 |
-9,871 |
-11,242 |
-13,984 |
- 1.00 lot is equivalent of 100 units
- Calculations for exchange rate used as of 09:10 (GMT+1) 24/06/2025
There is a possibility to use Stop-Loss and Take-Profit.
- You may wish to consider closing your position in profit, even if it is lower than suggested one.
- Trailing stop technique could protect the profit.