GOLD weekly special report based on 1.00 Lot Calculation:
GEOPOLITICS: MIDDLE EAST
- EVENT (FRIDAY, FEBRUARY 6): US-IRAN NUCLEAR TALKS IN OMAN. According to the latest reports, US and Iranian delegations will meet on Friday to seek a deal under which Iran would halt its nuclear program and missile production, according to the US side. However, reports suggest Iran may resist these terms, raising the risk of failure, as seen in June 2025 before the Israeli/US strikes on Iran.
- BREAKING (LATE JANUARY – EARLY FEBRUARY): US MILITARY ASSETS ARRIVED IN INTERNATIONAL WATERS NEAR IRAN AND ARE READY TO INTERVENE. The US “USS ABRAHAM LINCOLN” carrier and its group have arrived from to the Arabian Sea near the Gulf of Oman. Along the carrier the group is escorted with missile destroyers like the USS Spruance, USS Michael Murphy and USS Frank E Petersen. Now, Iranian targets are within the striking range of this battle group.
GEOPOLITICS: USA – UKRAINE – RUSSIA TRILATERAL SUMMIT
- EVENT (WEDNESDAY - THURSDAY, FEBRUARY 4 - 5): ANOTHER ROUND OF THE USA-UKRAINE-RUSSIA TRILATERAL SUMMIT WILL TAKE PLACE. If peace talks break down, higher geopolitical tensions could be expected, creating support for Gold. A new trilateral summit is set to take place in Abu Dhabi, following “constructive” talks held during January 23-24.
EVENTS
- FRIDAY, FEBRUARY 6 AT 15:00 GMT: US MICHIGAN CONSUMER SENTIMENT (FEBRUARY). US consumer sentiment has improved over the past 3 to 4 months, with the Michigan Index rising to its highest level since September 2025 (56.4) in January. However, if the index in February shows stagnation or a decline, this could revive concerns about the US economy, supporting gold prices.
- WEDNESDAY, FEBRUARY 11 AT 13:30 GMT: US INFLATION DATA (CPI) (JANUARY). A low inflation print would reinforce the case for Fed rate cuts, putting negative pressure on the US dollar, while supporting gold prices. The headline CPI in the USA is currently at 2.7%, down from the recent 3%.
- TUESDAY, FEBRUARY 24: US PRESIDENT DONALD TRUMP AND HIS STATE OF THE UNION ADDRESS. President Trump will address a joint session of Congress marking a key yearly political event. Trump is likely to outline US administration successes so far and give a preview on plans for the rest of the year.
PRICE ACTION
- GOLD PRICE HIT A NEW ALL-TIME HIGH ON JANUARY 28, 2026 ($5,597.41). Gold currently trades around $5,035, and if it fully recovers to its previous all-time high, it could see an upside of around $560. However, the price could also decline.
- ANALYSTS’ OPINION: Bank of America forecasts $6,000; Goldman Sachs forecasts $5,400; Morgan Stanley forecasts $5,700; UBS forecasts $6,000; J.P.Morgan forecasts $6,300; Deutsche Bank forecasts $6,000; Societe General forecasts $6,000;
TECHNICAL ANALYSIS AND PRICE ACTION:
- LONG-TERM TREND IS UP. The overall trend of gold is up (black trendline), with the trend accelerating since mid – August of 2025.
- SUPPORT AREA: $4,600 – $4,400. After the most recent downward price correction that took place in late January 2026, gold prices have found a support zone in the range between $4,600 and $4,400.
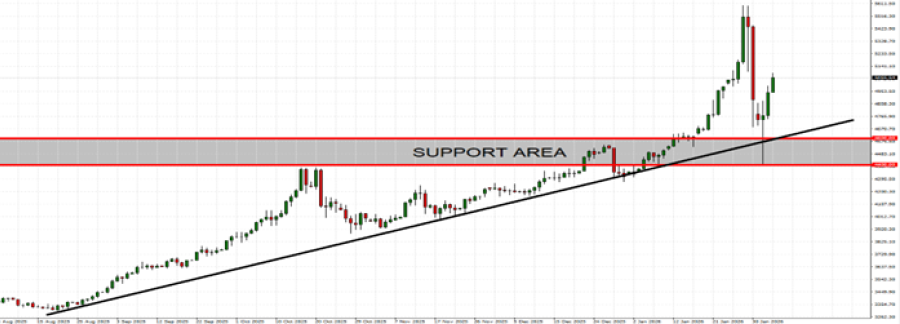
GRAPH (Daily): August 2025 – February 2026
Please note that past performance does not guarantee future results
GOLD, February 4, 2026
Current Price: 5,035
|
GOLD |
Weekly |
|
Trend direction |
|
|
6,000 |
|
|
5,700 |
|
|
5,400 |
|
|
4,700 |
|
|
4,650 |
|
|
4,600 |
Example of calculation base on weekly trend direction for 1.00 Lot1
|
GOLD |
||||||
|
Pivot Points |
||||||
|
Profit or loss in $ |
96,500 |
66,500 |
36,500 |
-33,500 |
-38,500 |
-43,500 |
|
Profit or loss in €2 |
81,685 |
56,291 |
30,896 |
-28,357 |
-32,589 |
-36,822 |
|
Profit or loss in £2 |
70,382 |
48,502 |
26,621 |
-24,433 |
-28,080 |
-31,727 |
|
Profit or loss in C$2 |
131,728 |
90,776 |
49,825 |
-45,730 |
-52,555 |
-59,380 |
- 1.00 lot is equivalent of 100 units
- Calculations for exchange rate used as of 13:00 (GMT) 04/02/2026
There is a possibility to use Stop-Loss and Take-Profit.
- You may wish to consider closing your position in profit, even if it is lower than suggested one.
- Trailing stop technique could protect the profit.