USA100 Weekly Special Report based on 1.00 Lot Calculation:
USA100:
- USA100 represents the Nasdaq 100, which includes 100 of the largest and most innovative non-financial companies listed on the Nasdaq exchange. It features global tech and AI leaders such as Apple, Google, Tesla, Nvidia, Meta, Microsoft, Amazon, and others. In essence, USA100 reflects the strength and evolution of the modern digital economy in the United States.
EVENTS:
- TUESDAY, FEBRUARY 10 AT 13:30 GMT: US RETAIL SALES DATA (DECEMBER). Strong retail sales would signal resilient consumer demand, supporting corporate revenue expectations and reinforcing bullish momentum in the USA100.
- WEDNESDAY, FEBRUARY 11 AT 13:30 GMT: US INFLATION DATA (CPI) (JANUARY). A low inflation print would reinforce the case for Fed rate cuts, boosting risk appetite and providing strong upside support for growth and tech stocks in the USA100.
- FRIDAY, FEBRUARY 20 AT 13:30 GMT: US GROSS DOMESTIC PRODUCT (Q4). A stronger Q4 GDP reading would confirm solid economic momentum, improving the outlook for corporate earnings and providing a supportive backdrop for further gains in the USA100.
- TUESDAY, FEBRUARY 24: US PRESIDENT DONALD TRUMP: STATE OF THE UNION ADDRESS. President Trump will address a joint session of Congress marking a key yearly political event. Trump is likely to outline US administration successes so far and give a preview on plans for the rest of the year. He may address a variety of subjects including the US economy, trade, foreign policy, energy or taxation, which could all drive higher volatility with USA100.
Q4 EARNING SEASON (FEBRUARY 4-FEBRUARY 25):
- FEBRUARY 4 – FEBRUARY 25, 2026. The U.S. Q4 earnings season began in January, with major financial institutions already reporting. Key USA100 heavyweights such as Tesla, Meta, Apple, Intel, and AMD have now posted their Q4 2025 results. The next major companies still to report are Amazon, Google, Walmart, NVIDIA, and others.
- ALPHABET (GOOGLE): 2/4/2026, Aftermarket
- ARM: 2/4/2026, Aftermarket
- AMAZON: 2/5/2026, Aftermarket
- FORD: 2/10/2026, Aftermarket
- MCDONALDS: 2/11/2026, Aftermarket
- APPLIED MATERIALS: 2/12/2026, Aftermarket
- RIVIAN AUTOMOTIVE: 2/12/2026, Aftermarket
- COINBASE: 2/12/2026, Aftermarket
- WALMART: 2/19/2026, Aftermarket
- NVIDIA: 2/25/2026, Aftermarket
TECHNICAL ANALYSIS:
- UP-TREND SINCE NOVEMBER 2025: USA100 has remained above the orange uptrend line since November 2025, confirming the bullish trend, though a breakout below the line remains a risk if market conditions shift.
- SUPPORT AREA: 24,650 – 24,850. This zone represents its next support area for USA100.
- USA100 HIT A FRESH ALL-TIME HIGH ON OCTOBER 30, 2025 (26,397.93). USA100 was last trading around 25,450, and if a full recovery to the recent all-time high takes place, it could see an upside potential of around 3.70%. However, the USA100 price could decline.
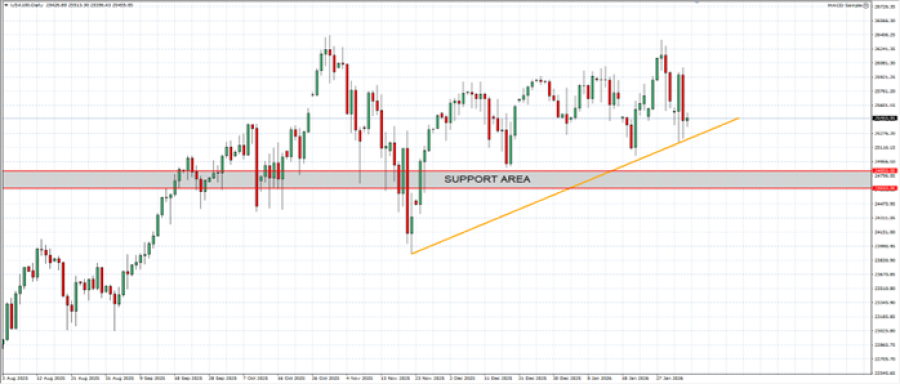
GRAPH (Daily): August 2025 – February 2026
Please note that past performance does not guarantee future results
#USA100, February 4, 2026
Current Price: 25,450
|
USA100 |
Weekly |
|
Trend direction |
|
|
27,500 |
|
|
26,750 |
|
|
26,250 |
|
|
24,850 |
|
|
24,750 |
|
|
24,650 |
Example of calculation based on weekly trend direction for 1.00 Lot1
|
USA100 |
||||||
|
Pivot Points |
||||||
|
Profit or loss in $ |
20,500 |
13,000 |
8,000 |
-6,000 |
-7,000 |
-8,000 |
|
Profit or loss in €² |
17,352 |
11,004 |
6,772 |
-5,079 |
-5,925 |
-6,772 |
|
Profit or loss in £² |
14,948 |
9,479 |
5,833 |
-4,375 |
-5,104 |
-5,833 |
|
Profit or loss in C$² |
28,011 |
17,763 |
10,931 |
-8,198 |
-9,565 |
-10,931 |
- 1.00 lot is equivalent of 10 units
- Calculations for exchange rate used as of 11:11 (GMT) 4/2/2026
There is a possibility to use Stop-Loss and Take-Profit
- You may wish to consider closing your position in profit, even if it is lower than the suggested one.
- Trailing stop technique could protect the profit