GOLD weekly special report based on 1.00 Lot Calculation:
GEOPOLITICS: MIDDLE EAST
- EVENT (WEDNESDAY, FEBRUARY 11): ISRAELI PRIME MINISTER NETANYAHU TO MEET US PRESIDENT TRUMP AFTER IRAN-U.S. ROUND OF NUCLEAR TALKS ON FRIDAY (FEBRUARY 6). Israeli Prime Minister Netanyahu will meet President Donald Trump in Washington on Wednesday about American talks with Iran, with Netanyahu insisting that the negotiations include Iran’s ballistic missile program, something which the Iranians have strongly opposed. If the talks break down, it could increase geopolitical uncertainty and create upward pressure for Gold.
- BREAKING (LATE JANUARY – EARLY FEBRUARY): US MILITARY ASSETS ARRIVED IN INTERNATIONAL WATERS NEAR IRAN AND ARE READY TO INTERVENE. The US “USS ABRAHAM LINCOLN” carrier and its group have arrived in the Arabian Sea near the Gulf of Oman. Along the carrier, the group is escorted by missile destroyers like the USS Spruance, USS Michael Murphy, and USS Frank E Petersen. Now, Iranian targets are within the striking range of this battle group.
CHINA: CHINA CONTINUED BUYING GOLD FOR 15 CONSECUTIVE MONTHS IN JANUARY 2026
- CHINA GOLD RESERVES UP TO 74.19 MILLION OUNCES IN JANUARY 2026, 15 MONTHS IN A ROW OF PURCHASES. China has managed to increase its gold reserves from 74.15 million ounces in December to a new, 74.19 million ounces in January 2026. This is their 15th consecutive increase in gold reserves on a monthly basis.
EVENTS
- WEDNESDAY, FEBRUARY 11 AT 13:30 GMT: US NONFARM PAYROLL (NFP) AND UNEMPLOYMENT RATE DATA (JANUARY): A lower-than-expected number of newly employed people as well as a higher-than-expected unemployment rate could be supportive for Gold, because it will signal more interest rate cuts by the FED in the near future. The data for the previous month stands at 50.000 which was lower than the month before at 56.000.
- FRIDAY, FEBRUARY 13 AT 13:30 GMT: US INFLATION DATA (CPI) (JANUARY). A low inflation print would reinforce the case for Fed rate cuts, putting negative pressure on the US dollar, while supporting gold prices. The headline CPI in the USA is currently at 2.7%, down from the recent 3%.
- TUESDAY, FEBRUARY 24: US PRESIDENT DONALD TRUMP AND HIS STATE OF THE UNION ADDRESS. President Trump will address a joint session of Congress, marking a key yearly political event. Trump is likely to outline US administration successes so far and give a preview of plans for the rest of the year.
PRICE ACTION
- GOLD PRICE HIT A NEW ALL-TIME HIGH ON JANUARY 28, 2026 ($5,597.41). Gold currently trades around $5,045, and if it fully recovers to its previous all-time high, it could see an upside of around $550. However, the price could also decline.
- ANALYSTS’ OPINION: Wells Fargo forecasts $6,100; Bank of America forecasts $6,000; Goldman Sachs forecasts $5,400; Morgan Stanley forecasts $5,700; UBS forecasts $6,200; JPMorgan forecasts $6,300; Deutsche Bank forecasts $6,000; Societe General forecasts $6,000.
TECHNICAL ANALYSIS AND PRICE ACTION:
- LONG-TERM TREND IS UP. The overall trend of gold is up (black trendline), with the trend accelerating since mid – August of 2025.
- SUPPORT AREA: $4,600 – $4,400. After the most recent downward price correction that took place in late January 2026, gold prices have found a support zone in the range between $4,600 and $4,400. However, it could also decline.
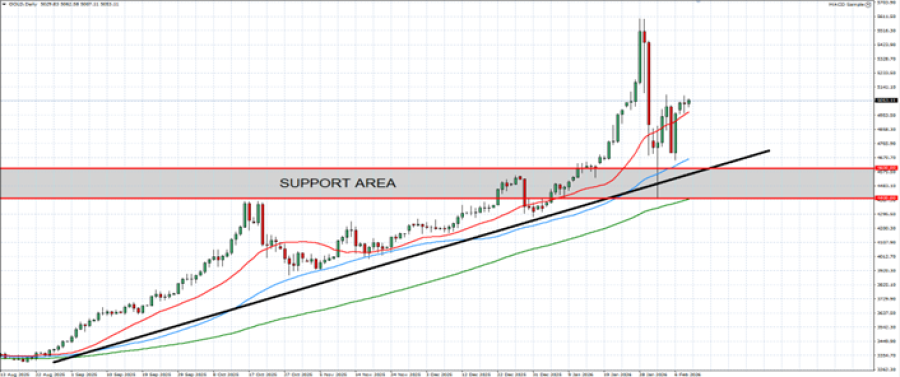
GRAPH (Daily): August 2025 – February 2026
Please note that past performance does not guarantee future results
GOLD, February 10, 2026
Current Price: 5,045
|
GOLD |
Weekly |
|
Trend direction |
|
|
6,000 |
|
|
5,700 |
|
|
5,400 |
|
|
4,700 |
|
|
4,650 |
|
|
4,600 |
Example of calculation base on weekly trend direction for 1.00 Lot1
|
GOLD |
||||||
|
Pivot Points |
||||||
|
Profit or loss in $ |
95,500 |
65,500 |
35,500 |
-34,500 |
-39,500 |
-44,500 |
|
Profit or loss in €2 |
80,187 |
54,997 |
29,808 |
-28,968 |
-33,166 |
-37,365 |
|
Profit or loss in £2 |
69,889 |
47,934 |
25,980 |
-25,248 |
-28,907 |
-32,566 |
|
Profit or loss in C$2 |
129,527 |
88,838 |
48,149 |
-46,792 |
-53,574 |
-60,355 |
- 1.00 lot is equivalent of 100 units
- Calculations for exchange rate used as of 11:00 (GMT) 10/02/2026
There is a possibility to use Stop-Loss and Take-Profit.
- You may wish to consider closing your position in profit, even if it is lower than suggested one.
- Trailing stop technique could protect the profit.