ALPHABET(#GOOGLE) weekly uptrend opportunity based On 1 Lot Calculation:
WEB SEARCH INDUSTRY:
-
ALMOST 67% OF ALL INTERNET SEARCHES ARE PERFORMED ON GOOGLE. Other companies that can compete with Google are BING, DuckDuckGo and etc.
ONLINE ADVERTISEMENT:
-
MARKET SIZE: $465.5 BILLION IN 2021 AND EXPECTED TO GROW TO $1.089 TRILLION IN 2027. The global internet advertising market size was valued more than $465.5 billion in 2021, and is projected to reach $1.089 trillion by 2027, registering an average growth of 22.32% from 2021 to 2027.
-
GLOBAL MARKETS: Google, Meta (formerly Facebook) and Amazon accounted for more than $7 in $10 (74%) of global digital ad spending in 2021, which is 47% of all money spent on advertising over that period.
-
MARKET SHARE IN THE U.S.: Alphabet (Google) at 26.4%, META (Facebook) at 24.1%, Amazon 14.6%, Rest at 34.9%.
GOOGLE:
-
THE COMPANY: Alphabet (Google) is the fourth largest company by market capitalization in the world, worth $1.423 trillion dollars.
-
ONLINE ADVERTISEMENT: 81.3% OF TOTAL REVENUE IN 2021 COMES FROM ADVERTISING.
-
STRONG POSITIVE REVENUE TREND (23% AVERAGE GROWTH RATE PER ANNUM FOR THE PAST FIVE YEARS): The company’s revenue grew by around 23% on average per year over the past five years.
STOCK SPLIT EVENT:
-
EVENT (STOCK SPLIT: 20 to 1): EFFECTIVE ON (MONDAY) JULY 18, 2022. According to MarketWatch, investors view stock splits as a sign of confidence by management, because splits happen more often in stocks that have bullish momentum behind them. Splits also increase liquidity by making shares more accessible to a wider range of investors. To reinforce the thesis of stock splits intended to reach a wider range of investors, Alphabet (Google) CFO commented on the split “The reason for the split is it makes our shares more accessible.”
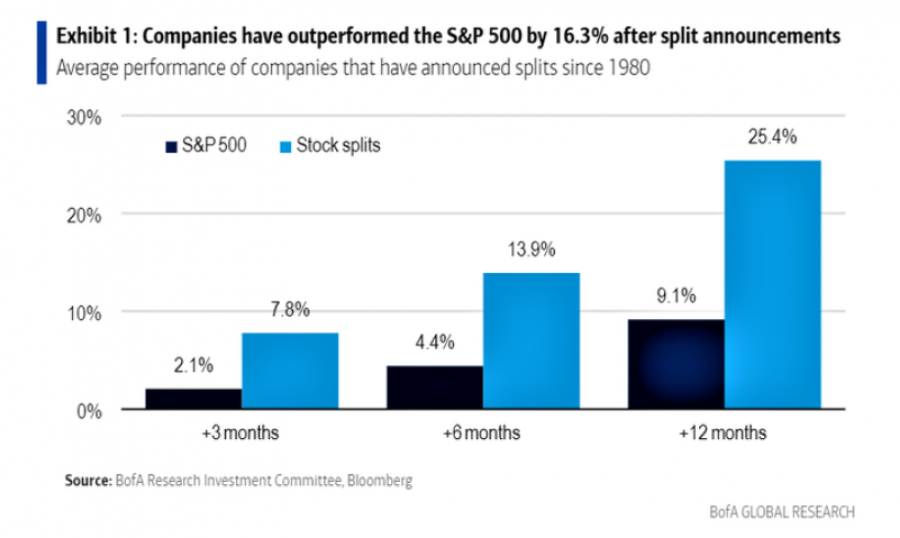
STATISTICS: Since 1980, the shares of companies that do stock splits are typically up 25% a year later, compared to 9% for the broader market, according to a recent study by Bank of America.
-
PERFORMANCE BEFORE THE STOCK SPLIT (TIME FRAME: ANNOUNCEMENT DATE TO STOCK SPLIT) (SOURCES: YahooFinance, Bloomberg, Fortrade MT4):
Tesla (STOCK SPLIT: 5-1 Announcement August 11, 2020): Tesla’s price appreciated around 60% from its announcement to the actual stock split date on the 31st of August 2020.
Apple (STOCK SPLIT: 2-1 Announcement July 30, 2020): Apple’s price increased around 30% since its split announcement on 30th of July 2020, until the effective date 31st August 2020.
NVidia (STOCK SPLIT: 4-1 Announcement May 21, 2021): Nvidia witnessed a percentage price increase of around 33% between its announcement date and the effective date of the split on July 20, 2021.
*Please note that past performance does not guarantee future results
-
STOCK PERFORMANCE AFTER STOCK SPLIT (SOURCES: YahooFinance, Bloomberg, Fortrade MT4):
Tesla (STOCK SPLIT: 5-1 effective August 31, 2020): 3 Months: +28%. 6 Months: +53%. 12 Months: +65.91%
Apple (STOCK SPLIT: 2-1 effective August 31, 2020): 3 Months: -4.5%. 6 Months: +2.11%. 12 Months: +22.00%
NVidia (STOCK SPLIT: 4-1 effective July 20, 2021): 3 Months: +17.60%. 6 Months: +30%. 12 Months
*Please note that past performance does not guarantee future results
OTHER EVENTS AND ANALYSIS:
-
PRICE ACTION: THE STOCK HAS HAD A DOWNWARD CORRECTION OF AROUND 33.00% FROM ITS ALL TIME HIGH OF $3060. The stock has fallen to its lowest rate in more than year, to $2043. Alphabet (Google) was last trading around $2250, and if full recovery follows to recent all- time highs, the stock could see an upside of around 36%.
-
ANALYST OPINION: Wells Fargo forecasts $3400. Morgan Stanley forecasts $3270. Credit Suisse forecasts $3400. JPMorgan forecasts $3200.
ALPHABET(#GOOGLE), May 31, 2022
Current Price: 2,250.00
|
|
Weekly |
|
Trend direction |
|
|
3,200.00 |
|
|
3,060.00 |
|
|
2,550.00 |
|
|
2,040.00 |
|
|
1,900.00 |
|
|
1,800.00 |
Example of calculation based on weekly trend direction for 1 Lot1
|
|
||||||
|
Pivot Points |
||||||
|
Profit or loss in $ |
95,000.00 |
81,000.00 |
30,000.00 |
-21,000.00 |
-35,000.00 |
-45,000.00 |
|
Profit or loss in €2 |
86,491.01 |
73,744.97 |
27,312.95 |
-19,119.07 |
-31,865.11 |
-40,969.43 |
|
Profit or loss in £2 |
71,961.52 |
61,356.66 |
22,724.69 |
-15,907.28 |
-26,512.14 |
-34,087.04 |
|
Profit or loss in C$2 |
119,274.40 |
101,697.12 |
37,665.60 |
-26,365.92 |
-43,943.20 |
-56,498.40 |
-
1.00 lot is equivalent of 100 units
-
Calculations for exchange rate used as of 10:30 (GMT+1) 31/05/2022
Fortrade recommends the use of Stop-Loss and Take-Profit, please speak to your Client Manager regarding their use.
-
You may wish to consider closing your position in profit, even if it is lower than suggested one
-
Trailing stop technique can protect the profit – Ask your Client Manager for more detail