MICROSOFT (#MICROSOFT) weekly special report based On 1 Lot Calculation:
ARTIFICIAL INTELLIGENCE:
- ARTIFICIAL INTELLIGENCE TECHNOLOGY CONTINUES TO GROW: According to IDC, global investments in Artificial Intelligence are projected to generate a cumulative economic impact of $22.3 trillion by 2030. Precedence Research estimates that the Generative AI market is valued at $37.89 billion in 2025 and is expected to reach approximately $1 trillion by 2034, registering a compound annual growth rate (CAGR) of 44.20% between 2025 and 2034.
- MICROSOFT IS A LEADER FOR ARTIFICIAL INTELLIGENCE PLATFORMS: According to recent data, Microsoft has introduced “Bing AI” and Copilot for Microsoft 365. Previously, Microsoft partnered with OpenAI, the developer of the most demanded AI application, ChatGPT. As of July 2025, ChatGPT has nearly 800 million weekly active users, almost doubling from the 400 million reported in February 2025.
MICROSOFT: EVENTS
- EVENT (WEDNESDAY, JULY 30, AFTERMARKET): Q2 2025 EARNINGS REPORT. Microsoft is expected to print $73.879 billion in revenue for Q2 of 2025. This is an increase of 14.14% from the same period last year ($64.727 billion). In addition, the company is expected to post Earnings Per Share (EPS) of $3.37, which could be an increase of around 13.85% from the same period last year ($2.96).
- QUARTERLY REVENUE AND EARNINGS (LAST 8 QUARTERS). Microsoft has beaten revenue and EPS expectations 8 out of the last 8 times.
- LAST TIME (Q1 RESULTS RELEASED APRIL 30, 2025, AFTERMARKET): Microsoft reported higher-than-expected revenue ($70.066 billion vs. $68.480 billion expected) and better-than-expected EPS ($3.46 vs. $3.22 billion expected) (Source: Bloomberg Terminal).
STOCK PERFORMANCE: Microsoft shares rose 7.40% one day after the release of its first-quarter results, and Microsoft shares rose 9.51% one week after the release of its first-quarter results. (Source: Meta Trader).
Please note that past performance does not guarantee future results
MICROSOFT: PRICE ACTION
- ANALYSTS OPINIONS: Mirae Asset Securities forecasts $663. Wells Fargo forecasts $600. Jefferies forecasts $600. Wedbush forecasts $600. Oppenheimer forecasts $600.
- THE STOCK HIT AN ALL-TIME HIGH OF $515.04 (July 18, 2025). The stock currently trades around $510, near its recent all-time high levels.
TECHNICAL ANALYSIS:
- UPTREND CHANNEL: The black uptrend channel depicted by the chart below shows that Microsoft prices have maintained their uptrend in general since March 2025. However, there remains a risk of a potential breakout below this level if market conditions change.
- WEEKLY MOVING AVERAGES POINT TO UPTREND: Microsoft has recently traded above the 20- and 50-week moving averages, pointing to an ongoing uptrend. However, Microsoft can change its trend if prices fall below the 20- and 50-week moving averages.
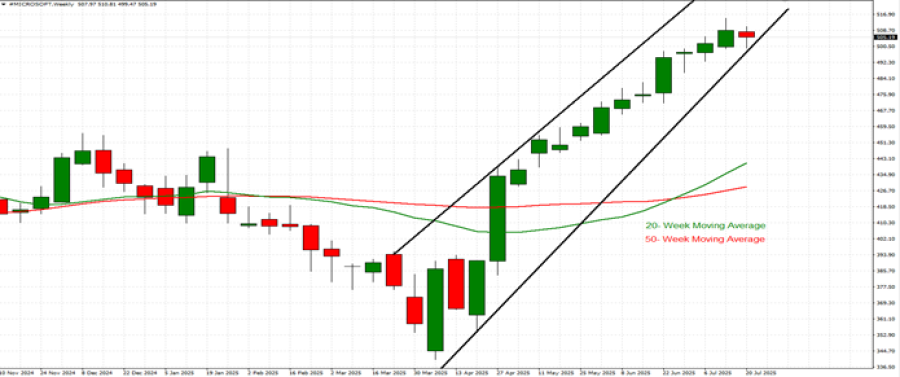
GRAPH (Weekly): November 2024 – July 2025
Please note that past performance does not guarantee future results
#MICROSOFT, July 25, 2025.
Current Price: 510
|
Microsoft |
Weekly |
|
Trend direction |
|
|
663 |
|
|
600 |
|
|
550 |
|
|
475 |
|
|
460 |
|
|
450 |
Example of calculation based on weekly trend direction for 1 Lot1
|
MICROSOFT |
||||||
|
Pivot Points |
||||||
|
Profit or loss in $ |
153,000 |
90,000 |
40,000 |
-35,000 |
-50,000 |
-60,000 |
|
Profit or loss in €2 |
130,308 |
76,652 |
34,067 |
-29,809 |
-42,584 |
-51,101 |
|
Profit or loss in £2 |
113,653 |
66,855 |
29,713 |
-25,999 |
-37,142 |
-44,570 |
|
Profit or loss in C$2 |
209,255 |
123,091 |
54,707 |
-47,869 |
-68,384 |
-82,061 |
- 1.00 lot is equivalent of 1000 units
- Calculations for exchange rate used as of 10:30 (GMT+1) 25/07/2025
There is a possibility to use Stop-Loss and Take-Profit
- You may wish to consider closing your position in profit, even if it is lower than suggested one.
- Trailing stop technique could protect the profit.