NATURAL GAS weekly special report based On 1.00 Lot Calculation:
NATURAL GAS GLOBAL MARKETS:
- LARGEST NATURAL GAS SUPPLIER IN THE WORLD (LNG + PIPELINE): 1. RUSSIA (173.81 million tons); 2. USA; 3. QATAR; 4. NORWAY; 5. AUSTRALIA;
- LARGEST NATURAL GAS IMPORTER IN THE WORLD: CHINA (121.99 million tons)
- CHINA’S LARGEST NATURAL GAS SUPPLIER: 1. AUSTRALIA (~26%); 2. TURKMENISTAN (~20%); 3. RUSSIA (~10%).
- E.U. IMPORTS 45% OF NEEDED NATURAL GAS FROM RUSSIA (OF TOTAL 251.44 million tons): 113 million tons (average daily consumption: 32.85 million tons).
- RUSSIA EXPORTS TO THE E.U. ACCOUNTS FOR 65% OF TOTAL EXPORTS: 113 million tons of 173.81 goes to the E.U.
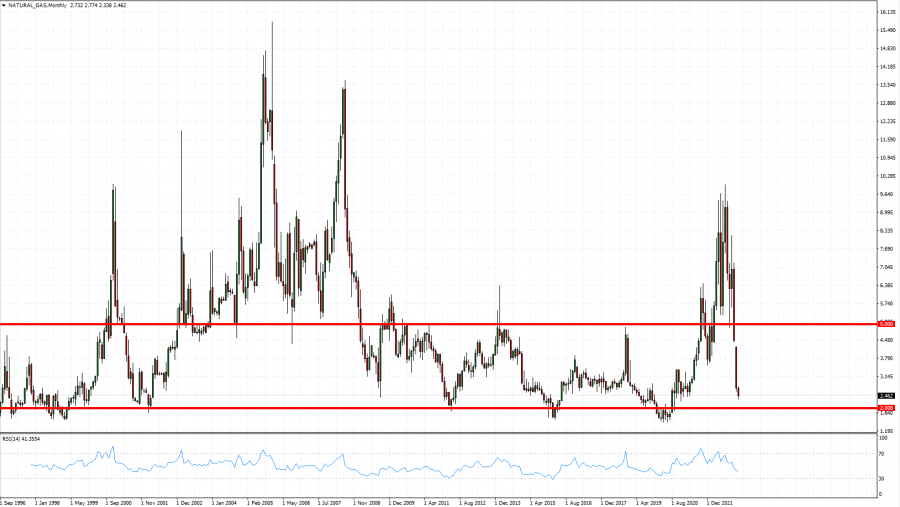
TECHNICAL REVIEW: The price has fallen to its traditional bottom of around 2.00. The bottom near 2 has been tested only six times since September 1996. Historically, when Natural Gas falls near the bottom of 2, that happens in the January- February period, while the recovery seems to be happening in March and beyond.
Graph: Natural Gas Price (1996-2023)
Source: MT4
STATISTICS: Average natural gas price in March ( 2000-2023) is $4.35 followed by further increase in April, when the price averaged $4.5. This is the period when countries start refilling their natural gas storages after winter which reflects on natural gas prices in a positive way.
Average Monthly Prices 2000-2022
|
March |
April |
May |
|
$4.35 |
$4.50 |
$4.30 |
Source: Yahoo Finance
However, please note that past performance does not guarantee future results.
CURRENT
- With China reopening its demand for Natural gas will rise. After 11% fall in 2022 analysts expect full recovery to 2021 levels in 2023. During 2022 China’s imports fell from 170Bcm to 150.7 Bcm in 2022.
- IEA (International Energy Administration) warns the EU could face almost 30 Bcm shortage in 2023. If China reopens and increases its demand to 2021 levels and pipeline imports from Russia stop, it would be extremely difficult for Europe to overcome the gas shortages.
- For the week ending Feb. 03 the The Energy Information Administration (EIA) reported a draw of 217 Bcf in natural gas storage inventories which was higher than forecasted.
- Freeport LNG confirmed that repairs had been completed at its liquefied natural gas export facility, which has been offline since June, and that a request to restart by introducing LNG to the piping system had been filed with regulators.
PRICE ACTION: Natural Gas prices rose to a record high of $15.780 in 2005. The most recent peak was in August of 2022 when the price reached $10.03. Currently it is moving around $2.46 and if a full recovery to 2022 highs happens, this could provide an increase of around 307.6%. However, the price could decline further.
NATURAL GAS, February 10, 2023
Current Price:2.46
|
NATURAL GAS |
Weekly |
|
Trend direction |
|
|
5.00 |
|
|
4.00 |
|
|
3.00 |
|
|
2.00 |
|
|
1.85 |
|
|
1.70 |
Example of calculation based on weekly trend direction for 1 Lot1
|
Pivot Points |
||||||
|
Profit or loss in $ |
25,400.00 |
15,400.00 |
5,400.00 |
-4,600.00 |
-6,100.00 |
-7,600.00 |
|
Profit or loss in €² |
23,696.35 |
14,367.08 |
5,037.81 |
-4,291.47 |
-5,690.86 |
-7,090.25 |
|
Profit or loss in £² |
20,975.53 |
12,717.45 |
4,459.36 |
-3,798.72 |
-5,037.43 |
-6,276.14 |
|
Profit or loss in C$² |
34,113.34 |
20,682.89 |
7,252.44 |
-6,178.01 |
-8,192.57 |
-10,207.14 |
1. 1 lot is equivalent of 10,000 units
2. Calculations for exchange rate used as of 09:50 (GMT) 10/02/2023
Fortrade recommends the use of Stop-Loss and Take-Profit, please speak to your Senior Account ManagerClient Manager regarding their use.
· You may wish to consider closing your position in profit, even if it is lower than suggested one
· Trailing stop technique can protect the profit – Ask your Senior Account ManagerClient Manager for more details