Natural Gas weekly special report based On 1 Lot Calculation:
FUNDAMENTAL FACTORS :
- FULL LABOR STRIKE IN AUSTRALIA THREATENS SUPPLY. Full production stoppages from September 14 at Chevron’s LNG export plants in Australia have made Natural Gas prices very volatile. As the world’s second-largest exporter of LNG, after Qatar, any work stoppages in Australia impact the global supply and increase pressure on US LNG export. The next talks between the union and Chevron are on September 22.
- NARROWING INVENTORY SURPLUSES: According to EIA reports, Natural Gas injections have been getting smaller and smaller which further narrow inventory surpluses and put supply pressures on natural gas prices.
- HIGHER DEMAND DUE TO HOT WEATHER IN TEXAS. Texas, which is one of the top U.S. gas consumers, especially during the summer months when air conditioning usage surges, caused higher demand for natural gas to generate electricity. Texas summers are known to last well into October which provides an upward trajectory for natural gas prices. Prices have also risen despite the end of “driving season”.
- PIPELINES ARE LIMITING US NATURAL GAS PRODUCTION Pipeline constraints are becoming an increasingly common refrain. Over the years, environmental groups in the Appalachian Basin, the country’s largest gas-producing region churning out more than 35 Bcf/d, have repeatedly stopped or slowed down pipeline projects. Additionally, Potential Gas Committee President Kristin Carter said “The availability of pipelines to get the product out of the shale gas fields in particular--there's only so much they can get to market without more of that infrastructure. So for that reason, you might have inactive well.”
STATISTICS (JULY- OCTOBER AVERAGE PRICE MOVEMENTS FOR THE PERIOD BETWEEN 2016 AND 2022):
- SEASONAL EFFECTS HISTORICALLY IMPACT NATURAL GAS PRICES WITH AN AVERAGE INCREASE OF 46.40% FROM JULY LOWS TO OCTOBER HIGHS (2016-2022): As shown by the table below, Natural Gas usually goes up between July and October. The move fundamentally could be explained by rising natural gas demand during hot months (air conditioning) like July and August and fears over natural gas shortages ahead of the winter season that starts in October.
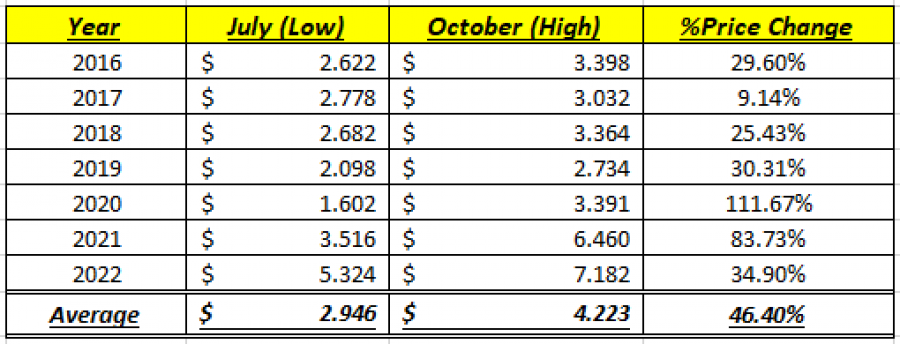
Source: MT4
*Please note that past performance does not guarantee future results.
- TECHNICAL REVIEW: The market faces substantial resistance near the $3.00 level. A decisive break above this threshold could trigger a rush of FOMO trading activity. Beyond this point, the 200-Day EMA enters the picture, followed by a target of $5.00, which seems attainable at some point during the winter season. Beneath the current price action, the $2.50 level has provided support over the last couple of months.
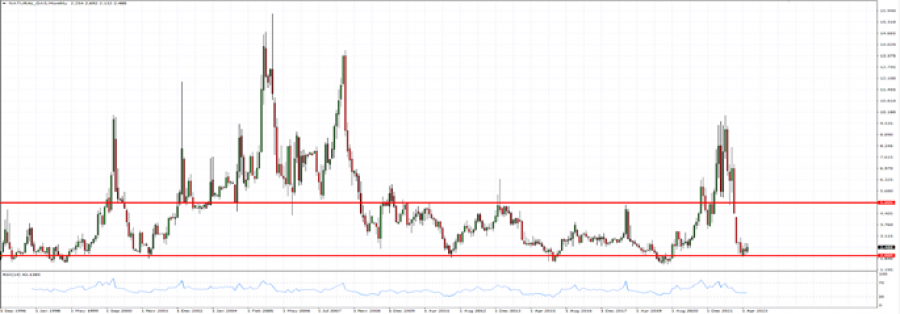
Source: MT4
Graph: Natural Gas Price (1996-2023)
NATURAL GAS, September 19, 2023
Current Price: 2.74
|
NATURAL GAS |
Weekly |
|
Trend direction |
|
|
3.90 |
|
|
3.50 |
|
|
3.10 |
|
|
2.40 |
|
|
2.35 |
|
|
2.30 |
Example of calculation based on weekly trend direction for 1 Lot1
|
Pivot Points |
||||||
|
Profit or loss in $ |
11,600.00 |
7,600.00 |
3,600.00 |
-3,400.00 |
-3,900.00 |
-4,400.00 |
|
Profit or loss in €² |
10,853.95 |
7,111.21 |
3,368.47 |
-3,181.33 |
-3,649.17 |
-4,117.02 |
|
Profit or loss in £² |
9,372.53 |
6,140.62 |
2,908.71 |
-2,747.12 |
-3,151.11 |
-3,555.10 |
|
Profit or loss in C$² |
15,602.87 |
10,222.57 |
4,842.27 |
-4,573.26 |
-5,245.79 |
-5,918.33 |
1. 1 lot is equivalent of 10,000 units
2. Calculations for exchange rate used as of 08:05 (GMT+1) 19/09/2023
Fortrade recommends the use of Stop-Loss and Take-Profit, please speak to your Senior Account ManagerClient Manager regarding their use.
· You may wish to consider closing your position in profit, even if it is lower than suggested one
· Trailing stop technique can protect the profit – Ask your Senior Account ManagerClient Manager for more details