Natural Gas weekly special report based on 1.00 Lot Calculation:
GEOPOLITICS:
- MIDDLE EAST TENSIONS RISE: ISRAEL – IRAN CONFLICT CONTINUED THIS WEEK. Israel has carried out strikes on Iran, targeting its nuclear facilities, ballistic missile factories and petroleum and gas fields. On the other hand, Iranian missiles have struck Israel as it has been the case since Friday (June 13) night.
- QATAR EXPORTS COULD BE JEOPARDIZED DUE TO POTENTIAL CLOSURE OF THE HORMUTZ STRAIT BY IRAN. Qatar is among the top three largest LNG exporters in the world. Most of the exports go through the Hormuz Strait, which is being reviewed by Iran to shut down due to the ongoing conflict with Israel and the USA. Qatar sends more than 70% of its Liquefied Natural Gas (LNG) exports to Asia and 25% to Europe, according to Kpler tanker tracking data. Qatar sends 77 million tonnes of LNG every year through the Strait of Hormuz to customers. This is up to 20% of total LNG exports worldwide.
TECHNICAL ANALYSIS:
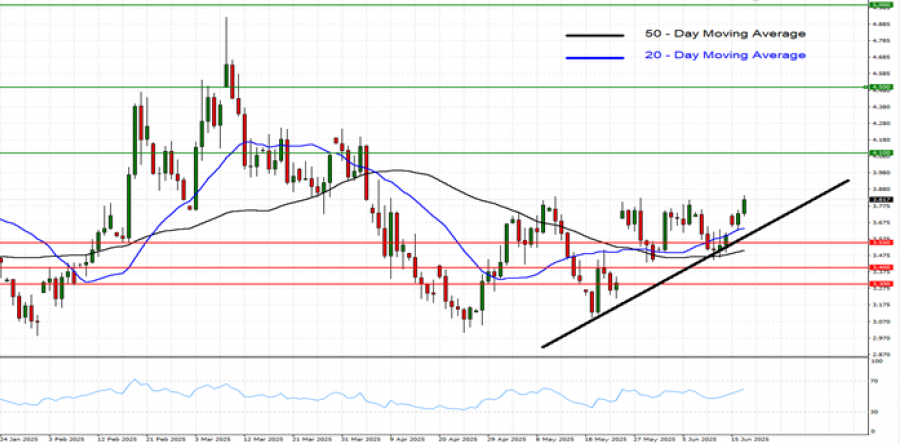
- 50- DAY AND 20 - DAY MOVING AVERAGES INDICATE UPTREND: The Natural Gas price has moved above the 20-day and 50- day moving averages, indicating an ongoing uptrend.
- 14- DAY RELATIVE STRENGTH INDEX (RSI) INDICATES AN UPTREND. The 14- Day Relative Strength Index currently trades around 60, above the neutral point of 50, indicating positive momentum. Although, this could change if the index breaks below the mark of 50 again.
- SHORT-TERM UPTREND SINCE MAY 2025: As depicted by the daily chart below, the natural gas price has kept trading above the short-term black- lined uptrend line, confirming its short-term trend is up.
GRAPH (Weekly): January 2025 – June 2025
Please note that past performance does not guarantee future results
NATURAL GAS: PRICE ACTION
- NATURAL GAS PRICES HIT $9.972 IN AUGUST, 2022. Natural gas prices have risen due to Europe’s crisis and reduced Russian supply, boosting U.S. LNG demand. A rebound to $9.972 would represent a rise of approximately 162% from the current price of $3.8, though price declines cannot be ruled out.
Natural Gas, June 17, 2025
Current Price: 3.800
|
NATURAL GAS |
Weekly |
|
Trend direction |
|
|
5.00 |
|
|
4.50 |
|
|
4.10 |
|
|
3.55 |
|
|
3.40 |
|
|
3.30 |
Example of calculation based on weekly trend direction for 1.00 Lot1
|
NATURAL GAS |
||||||
|
Pivot Points |
||||||
|
Profit or loss in $ |
12,000 |
7,000 |
3,000 |
-2,500 |
-4,000 |
-5,000 |
|
Profit or loss in €² |
10,397 |
6,065 |
2,599 |
-2,166 |
-3,466 |
-4,332 |
|
Profit or loss in £² |
8,873 |
5,176 |
2,218 |
-1,848 |
-2,958 |
-3,697 |
|
Profit or loss in C$² |
16,309 |
9,514 |
4,077 |
-3,398 |
-5,436 |
-6,796 |
- 1.00 lot is equivalent of 10,000 units
- Calculations for exchange rate used as of 15:45 (GMT+1) 17/06/2025
There is a possibility to use Stop-Loss and Take-Profit.
- You may wish to consider closing your position in profit, even if it is lower than the suggested one.
- Trailing stop techniques could protect the profit.