Natural Gas weekly special report based on 1.00 Lot Calculation:
TECHNICAL ANALYSIS:
- LONGER-TERM UPTREND: Natural Gas continues to respect its long-term rising trendline (green), which has been in place since January 2024. Despite several corrections, each major pullback has produced a higher low, confirming that the broader upward structure remains intact. As long as prices hold above this trendline, the long-term tone stays constructive.
- MOVING AVERAGES TREND POSITIVE. The 20-day moving average (red) has recently crossed above the 50-day moving average (blue), a short-term positive crossover that often signals renewed upside momentum. Both moving averages are now sloping upward, indicating that short and medium-term trends are supportive of further rise. However, there remains a risk of a potential breakout below this level if market conditions change.
- SUPPORT: $3.00. According to the chart below, Natural Gas prices have tested the area near $3.00 several times since November 2024. Natural Gas prices have spent most of their time since November 2024 above the mark of $3.00, signifying limited downside potential.
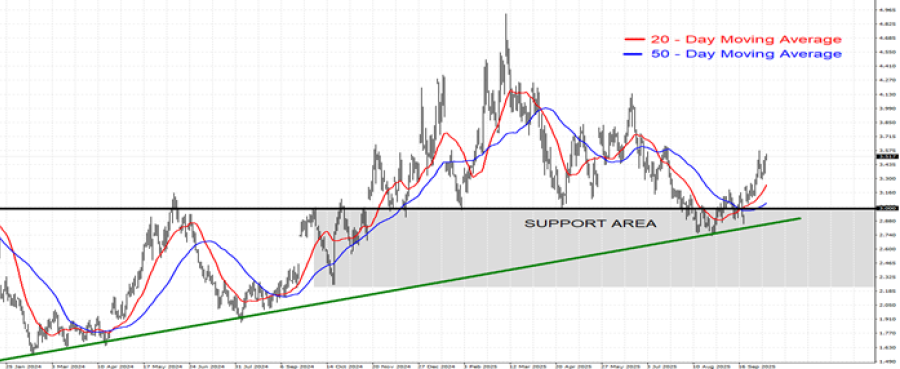
GRAPH (Daily): January 2024– October 2025
Please note that past performance does not guarantee future results
MARKET FUNDAMENTALS
- U.S. LNG (LIQUEFIED NATURAL GAS) EXPORTS REACHED AN ALL-TIME HIGH OF 9.4 MILLION METRIC TONS IN SEPTEMBER 2025, marking the second consecutive monthly record. Roughly two-thirds of total U.S. LNG shipments were directed to Europe, highlighting the region’s growing dependence on American gas. (Source: Reuters)
- E.U. GAS STORAGES ARE AT THE LOWEST LEVEL SINCE 2021 (FOR THIS PERIOD OF THE YEAR). EU gas storage stood at 82.75% of capacity as of October 4, down from 94.32% last year and at its lowest levels since 2021. (Source: Reuters)
- EUROPEAN LNG IMPORTS HAVE RISEN BY ROUGHLY 25% IN THE FIRST NINE MONTHS OF 2025 compared to 2024, according to the US Government’s Energy Information Administration (EIA).
STATISTICAL REVIEW:
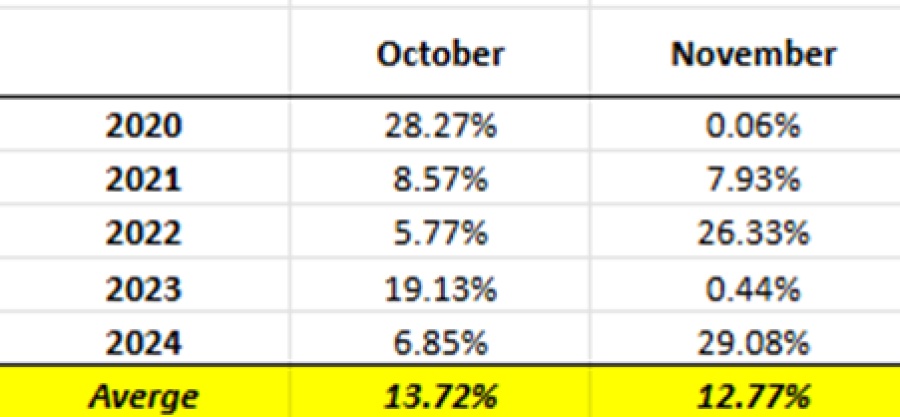
- THE HEATING SEASON INCREASES DEMAND FOR NATURAL GAS. During the heating season, which typically spans from October to March in both Europe and the United States, natural gas prices tend to rise as demand for heating increases.
- STATISTICS (2020 – 2025): NATURAL GAS PRICES ROSE ON AVERAGE 13.72% IN OCTOBER AND 12.77% IN NOVEMBER. Historical data indicate that, on average, prices have shown a notable increase at the start of the season, with an average rise of about 13.72% in October and 12.77% in November, measured from the beginning of each month to the highest recorded levels. This pattern reflects the market’s early response to anticipated winter demand and potential supply risks. The detailed averages are presented in the accompanying table.
Data Source: Meta Trader 4 Platform
Please note that past performance does not guarantee future results
Natural Gas, October 8, 2025.
Current Price: 3.510
|
NATURAL GAS |
Weekly |
|
Trend direction |
|
|
4.500 |
|
|
4.100 |
|
|
3.800 |
|
|
3.250 |
|
|
3.100 |
|
|
3.000 |
Example of calculation based on weekly trend direction for 1.00 Lot1
|
NATURAL GAS |
||||||
|
Pivot Points |
||||||
|
Profit or loss in $ |
9,900 |
5,900 |
2,900 |
-2,600 |
-4,100 |
-5,100 |
|
Profit or loss in €² |
8,517 |
5,076 |
2,495 |
-2,237 |
-3,527 |
-4,388 |
|
Profit or loss in £² |
7,383 |
4,400 |
2,163 |
-1,939 |
-3,058 |
-3,804 |
|
Profit or loss in C$² |
13,802 |
8,225 |
4,043 |
-3,625 |
-5,716 |
-7,110 |
- 1.00 lot is equivalent of 10,000 units
- Calculations for exchange rate used as of 12:25 (GMT+1) 08/10/2025
There is a possibility to use Stop-Loss and Take-Profit.
- You may wish to consider closing your position in profit, even if it is lower than the suggested one.
- Trailing stop techniques could protect the profit.