Natural Gas weekly special report based on 1.00 Lot Calculation:
NATURAL GAS USE AND MARKET SHARE:
- NATURAL GAS is mainly used for electricity generation and heating. In the U.S., about 45% of homes use natural gas for heating. Industries like chemicals, petroleum refining, metals production, food processing, and manufacturing (glass, bricks, paper) also consume large amounts of natural gas. Natural gas is favored for its efficiency and lower emissions compared to other fossil fuels.
- MARKET SHARE - PRODUCERS: BIGGEST NATURAL GAS PRODUCERS IN THE WORLD: U.S. is the largest producer, with around 25% of the global market share, while Russia is the second with around 15% of the market. Iran is third with roughly 5%.
- MARKET SHARE - LNG (LIQUEFIED NATURAL GAS) EXPORTERS: U.S. is the major LNG exporter, holding close to 21% of the global market share, while Australia is the second with 20% of the market. Qatar is third with 19% and Russia fourth with 8% of the global market.
- MARKET SHARE - CONSUMERS: U.S. is the world's largest natural gas consumer, with 22% of global consumption, while Russia holds 11.6%, EU 11% and China 10.6%.
- MARKET SHARE - LNG- LIQUEFIED NATURAL GAS IMPORTERS: China is the world's largest LNG importer, with 19-23.5% of global imports, Japan is second with 16%- 18% and EU 14%-15%. (Source: IEA)
EUROPE AND NATURALS GAS IMPORTS
- U.S. LNG (LIQUEFIED NATURAL GAS) EXPORTS REACHED AN ALL-TIME HIGH OF 10.1 MILLION METRIC TONS IN OCTOBER 2025, marking the third consecutive monthly record. Roughly 69% of total U.S. LNG shipments were directed to Europe, highlighting the region’s growing dependence on American gas. (Source: eia)
- EU WILL CONTINUE RELYING ON THE US: According to Reuters, the US will supply around 70% of Europe’s LNG in 2026-2029 up from 58% so far this year, as EU plans to ban Russian LNG from 2027 and Russian Gas from 2028.
EVENTS
- THURSDAY, NOVEMBER 20 AT 15:30 GMT: ENERGY INFORMATION ADMINISTRATION (EIA) NATURAL GAS INVENTORY DATA (USA). If the data shows a declining inventory for the past week, it could point to higher demand, which could prove supportive for Natural gas prices. However, the price could decline.
WEATHER FORECAST
- U.S. WINTER WEATHER FORECASTS FOR NOVEMBER 2025 PREDICT COLDER-THAN-NORMAL TEMPERATURES across much of the northern and central states. Arctic air outbreaks may cause temperature drops 10-15 degrees below average, boosting heating demand and supporting recent natural gas price rises.
TECHNICAL ANALYSIS:
- SHORT-TERM UPTREND CHANNEL. Natural Gas is trading within a rising short-term trend channel, coinciding with the heating season in the US. The price continues to move along the upper boundary of this channel, indicating steady upward momentum. If the price movement remains within the band we could expect positive sentiment for Natural Gas.
- DAILY MOVING AVERAGES SIGLANLING UPTREND: Natural Gas has been moving above the 20-, 50- and 100-day moving averages, pointing to an uptrend. However, if the price of Natural Gas drops below these moving averages the trend could reverse.
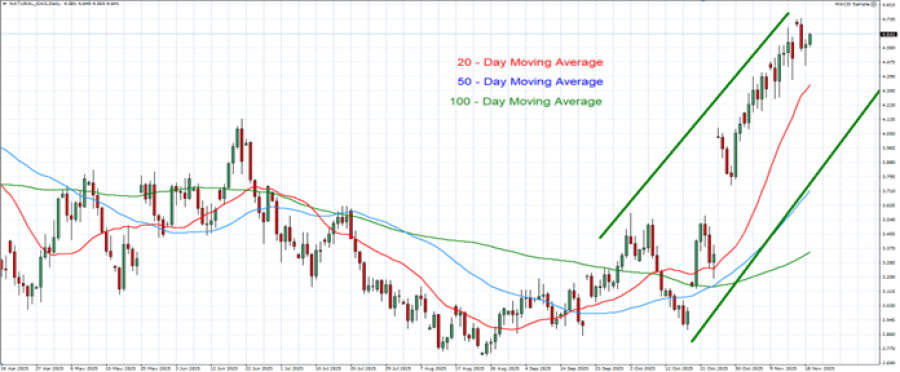
GRAPH (Daily): April 2024–November 2025
Please note that past performance does not guarantee future results
Natural Gas, November 19, 2025.
Current Price: 4.65
|
NATURAL GAS |
Weekly |
|
Trend direction |
|
|
5.20 |
|
|
5.10 |
|
|
4.95 |
|
|
4.40 |
|
|
4.35 |
|
|
4.30 |
Example of calculation based on weekly trend direction for 1.00 Lot1
|
NATURAL GAS |
||||||
|
Pivot Points |
||||||
|
Profit or loss in $ |
5,500 |
4,500 |
3,000 |
-2,500 |
-3,000 |
-3,500 |
|
Profit or loss in €² |
4,748 |
3,885 |
2,590 |
-2,158 |
-2,590 |
-3,022 |
|
Profit or loss in £² |
4,191 |
3,429 |
2,286 |
-1,905 |
-2,286 |
-2,667 |
|
Profit or loss in C$² |
7,702 |
6,302 |
4,201 |
-3,501 |
-4,201 |
-4,901 |
- 1.00 lot is equivalent of 10,000 units
- Calculations for exchange rate used as of 11:50 (GMT) 19/11/2025
There is a possibility to use Stop-Loss and Take-Profit.
- You may wish to consider closing your position in profit, even if it is lower than the suggested one.
- Trailing stop techniques could protect the profit.