Natural Gas weekly special report based on 1.00 Lot Calculation:
NATURAL GAS USE AND MARKET SHARE:
- NATURAL GAS is mainly used for electricity generation and heating. In the U.S., about 45% of homes use natural gas for heating.
- MARKET SHARE - PRODUCERS: BIGGEST NATURAL GAS PRODUCERS IN THE WORLD. The U.S. is the largest producer, with ~25% of the global market share, while Russia is the second with ~15% of the market. Iran is third with ~5%.
- MARKET SHARE - LNG (LIQUEFIED NATURAL GAS) EXPORTERS: The U.S. is the major LNG exporter, holding ~ 21% of the global market share, while Australia is the second with ~ 20% of the market. Qatar is third with ~19% and Russia fourth with ~ 8% of the global market.
- MARKET SHARE - CONSUMERS: The U.S. is the world's largest natural gas consumer, with ~ 22% of global consumption, while Russia holds ~ 11.6%, the EU ~11%, and China ~ 10.6%.
- MARKET SHARE - LNG- LIQUEFIED NATURAL GAS IMPORTERS: China is the world's largest LNG importer, with ~19-23.5% of global imports, Japan is second with ~ 16%- 18%, and the EU ~14%-15%. (Source: IEA)
EVENTS:
- THURSDAY, JANUARY 15 AT 15:30 GMT: U.S. WEEKLY NATURAL GAS STORAGE DATA. According to data from the past six weeks, U.S. natural gas inventories have declined in multiple consecutive weeks, confirming tightening fundamentals. If another larger-than-expected decline is reported, it would reinforce the tightening trend and could provide further upside support for natural gas prices.
GEOPOLITICS: RUSSIA – UKRAINE CONFLICT
- BREAKING (JANUARY 9): RUSSIA HITS UKRAINE WITH RARELY USED ORESHNIK MISSILE IN FRESH STRIKES. According to the BBC, Russia launched a large-scale missile and drone attack on Ukraine, including the rare use of the Oreshnik ballistic missile, hitting infrastructure near Lviv, close to the EU border. Ukrainian authorities confirmed damage to energy infrastructure and power disruptions, while attacks on power plants remain a recurring feature of the conflict.
- BREAKING (JANUARY 8): ZELENSKIY SEEKS NEW TALKS WITH TRUMP AS KEY ISSUES REMAIN UNRESOLVED. Ukrainian President Volodymyr Zelenskiy has called for another meeting with U.S. President Donald Trump following discussions with European leaders in Paris. Talks focused on sensitive issues such as territorial control and the future of the Zaporizhzhia nuclear power plant, Europe’s largest. Despite diplomatic efforts, major disagreements remain, keeping geopolitical tensions elevated.
EU NATURAL GAS CAPACITY
- EU NATURAL GAS CAPACITY BELOW AVERAGES: The EU natural gas capacity is at 58.1% full, down 18.4% from its 5-year average, indicating tighter supply conditions and strong demand across the region.
US WEATHER FORECAST (SECOND HALF OF JANUARY)
- WEATHER FORECASTS (Source: noaa.gov): Forecasts for late January 2026 show that another cold blast may hit the northern and eastern United States. If this occurs, demand for natural gas could increase, as more than 40% of U.S. households use natural gas for heating.
TECHNICAL ANALYSIS
- STRONG SUPPORT ZONE AT $3.00: Since late 2024, natural gas has repeatedly found strong support near the $3.00 level, with prices rebounding toward $3.50 or higher each time the market approached this zone. This area has been tested seven times since November 2024, with natural gas prices rising by an average of around 34% after testing this key support level. However, it could also decline.
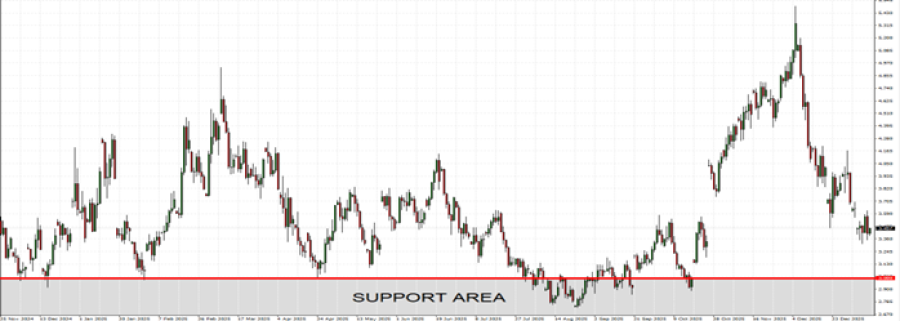
GRAPH (Daily): November 2024 – January 2026
Please note that past performance does not guarantee future results
Natural Gas, January 9, 2026
Current Price: 3.45
|
NATURAL GAS |
Weekly |
|
Trend direction |
|
|
4.500 |
|
|
4.200 |
|
|
4.000 |
|
|
3.100 |
|
|
3.000 |
|
|
2.900 |
Example of calculation based on weekly trend direction for 1.00 Lot1
|
NATURAL GAS |
||||||
|
Pivot Points |
||||||
|
Profit or loss in $ |
10,500 |
7,500 |
5,500 |
-3,500 |
-4,500 |
-5,500 |
|
Profit or loss in €² |
9,017 |
6,441 |
4,723 |
-3,006 |
-3,864 |
-4,723 |
|
Profit or loss in £² |
7,828 |
5,591 |
4,100 |
-2,609 |
-3,355 |
-4,100 |
|
Profit or loss in C$² |
14,567 |
10,405 |
7,630 |
-4,856 |
-6,243 |
-7,630 |
- 1.00 lot is equivalent of 10,000 units
- Calculations for exchange rate used as of 09:30 (GMT) 09/01/2026
There is a possibility to use Stop-Loss and Take-Profit.
- You may wish to consider closing your position in profit, even if it is lower than the suggested one.
- Trailing stop techniques could protect the profit.