Palantir (#PALANTIR) weekly special report based on 1.00 Lot Calculation:
PALANTIR: ARTIFICIAL INTELLIGENCE
- ARTIFICIAL INTELLIGENCE TECHNOLOGY CONTINUES TO GROW: According to IDC, global investments in Artificial Intelligence are projected to generate a cumulative economic impact of $22.3 trillion by 2030. Precedence Research estimates that the Generative AI market is valued at $37.89 billion in 2025 and is expected to reach approximately $1 trillion by 2034, registering a compound annual growth rate (CAGR) of 44.20% between 2025 and 2034.
PALANTIR: THE COMPANY
- Palantir Technologies is a software company specializing in big data analytics and artificial intelligence. It primarily offers platforms, Palantir Gotham and Palantir Foundry, to government agencies, defence sectors, and large enterprises for tasks like intelligence analysis, risk assessment, and operational decision-making.
- US GOVERNMENT IS PALANTIR`S LARGEST CLIENT: Palantir gets more than 40% of its revenue from government agencies.
- PALANTIR JOINED THE S&P 500 INDEX (USA500): Palantir joined the S&P 500 index on September 23, 2024.
- PALANTIR JOINED THE NASDAQ 100 INDEX (USA100): Palantir joined the Nasdaq 100 index on December 23, 2024.
PALANTIR: EVENTS
- EVENT (MONDAY, AUGUST 4, AFTERMARKET): Q2 2025 EARNINGS REPORT. Palantir is expected to print $939.8 million in revenue for Q2 of 2025. This is an increase of 38.59% from the same period last year ($678.1 million). In addition, the company is expected to post Earnings Per Share (EPS) of $0.073, which could be an increase of around 22% from the same period last year ($0.06).
- QUARTERLY REVENUE AND EARNINGS (LAST 8 QUARTERS). Palantir has beaten revenue and EPS expectations 8 out of the last 8 times.
- STOCK PERFORMANCE LAST 4 EARNINGS PRESENTATIONS: In the last full year (since Q2 2024), the stock has presented earnings 4 times (Q2 2024, Q3 2024, Q4 2024, Q1 2025). On average, the stock rose a 11.45% the day after the earnings were released. However, the price could go in the opposite direction.
Source: Bloomberg Terminal
Please note that past performance does not guarantee future results
PALANTIR: PRICE ACTION
- THE STOCK PRICE HIT AN ALL-TIME HIGH OF $160.04 (July 25, 2025). The stock price currently trades around $157. Since the beginning of the year, Palantir's stock price has risen by around 107%.
TECHNICAL ANALYSIS:
- UPTREND CHANNEL: The black uptrend channel depicted by the chart below shows that Palantir prices have maintained their uptrend in general since August 2024. However, there remains a risk of a potential breakout below this level if market conditions change.
- WEEKLY MOVING AVERAGES POINT TO UPTREND: Palantir has recently traded above the 20- and 50-week moving averages, pointing to an ongoing uptrend. However, Palantir can change its trend if prices fall below the 20- and 50-week moving averages.
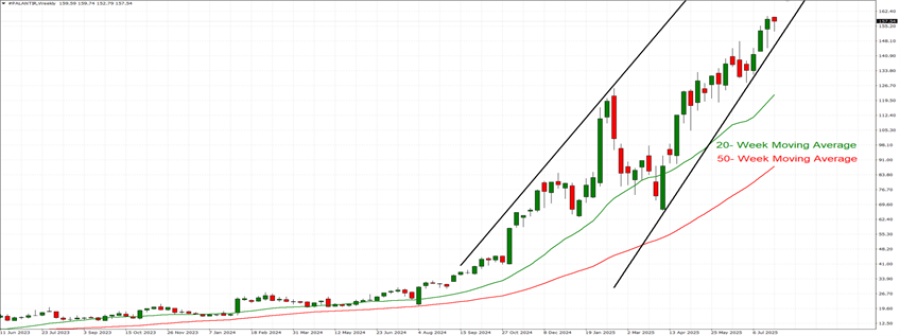
GRAPH (Weekly): June 2023 – July 2025
Please note that past performance does not guarantee future results
#PALANTIR, July 30, 2025.
Current Price: 157
|
PALANTIR |
Weekly |
|
Trend direction |
|
|
230 |
|
|
200 |
|
|
175 |
|
|
140 |
|
|
135 |
|
|
130 |
Example of calculation based on weekly trend direction for 1 Lot1
|
PALANTIR |
||||||
|
Pivot Points |
||||||
|
Profit or loss in $ |
365,000 |
215,000 |
90,000 |
-85,000 |
-110,000 |
-135,000 |
|
Profit or loss in €2 |
318,502 |
187,611 |
78,535 |
-74,172 |
-95,987 |
-117,802 |
|
Profit or loss in £2 |
274,864 |
161,906 |
67,775 |
-64,009 |
-82,836 |
-101,662 |
|
Profit or loss in C$2 |
502,656 |
296,085 |
123,943 |
-117,057 |
-151,485 |
-185,914 |
- 1.00 lot is equivalent of 5000 units
- Calculations for exchange rate used as of 15:00 (GMT+1) 30/07/2025
There is a possibility to use Stop-Loss and Take-Profit.
- You may wish to consider closing your position in profit, even if it is lower than suggested one.
- Trailing stop technique could protect the profit.