Palladium weekly special report based on 1.00 Lot Calculation:
TECHNICAL ANALYSIS:
- PALLADIUM PRICES TESTED THEIR LOWEST LEVELS IN ALMOST 4 MONTHS ($878).
- PALLADIUM PRICES HAVE TESTED THE MARK OF $900 (OR NEAR) ONLY 5 TIMES IN 2024. This is the 6th time that the Palladium prices are testing the mark of $900 or near.
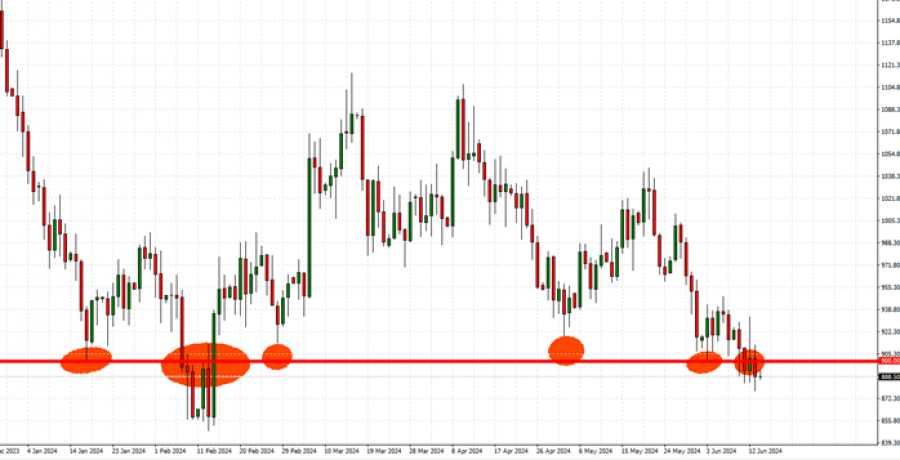
GRAPH (Daily): January 2024 – June 2024
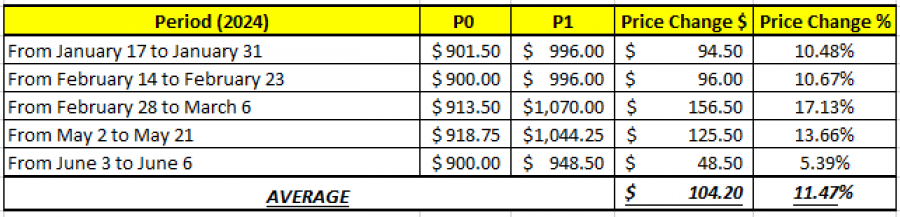
- 2024 STATISTICS: PALLADIUM TENDS TO RECOVER BY AROUND 13% AFTER TESTING THE MARK OF $900 OR NEAR IT.
DATA SOURCE: Fortrade MetaTrader 4
Please note that past performance does not guarantee future results
FUNDAMENTAL ANALYSIS:
PALLADIUM USE AND MARKET SHARE:
- Palladium is mostly used in catalytic converters by the car industry to reduce harmful gas emissions while tightening regulation is forcing automakers to put more Palladium into each vehicle, which in turn could keep the demand outlook positive. Palladium has also been used in fuel cells to generate power.
- MARKET SHARE (PRODUCERS): Russia is the largest producer holding 43% of the markets, while South Africa is the second largest with 33.00% of the markets. Canada is third on the list with 9.5% of the global production.
- MARKET SHARE (CONSUMERS): China is the largest Palladium consumer with 31%, while Europe and North America (USA) hold 20% each. Japan stands at 11%.
- RUSSIA EXPECTED TO CUT PRODUCTION IN 2024: NORNICKEL, THE LARGEST PALLADIUM PRODUCER IN THE WORLD, TO CUT PRODUCTION IN 2024. The Russian miner said the output of the metal may fall almost 15% to as low as 2.3 million ounces. The company said that its production was down 17% year on year in Q4 of 2023.
CHINA:
- MOST RECENT ECONOMIC DATA IN CHINA (MAY): Exports in May rose by 7.6%, exceeding analysts’ expectations for an increase of 6.0%. Imports rose by 1.8%, missing analysts’ expectations for an increase of 4.2%. In addition, Inflation came out at 0.3%, unchanged from the previous 0.3%. From earlier, Q1 GDP data also beat expectations, coming in at 5.3%. (expected: 5.2%)
EVENTS (CHINA): ECONOMIC DATA (MONTHLY) FOR MAY
- MONDAY, JUNE 17 AT 03:00 GMT+1: CHINA INDUSTRIAL PRODUCTION (MAY) (PREVIOUS: 6.7%)
PALLADIUM, June 14, 2024
Current Price: 895
|
PALLADIUM |
Weekly |
|
Trend direction |
|
|
1200 |
|
|
1100 |
|
|
950 |
|
|
845 |
|
|
830 |
|
|
820 |
Example of calculation base on weekly trend direction for 1.00 Lot1
|
Pivot Points |
||||||
|
Profit or loss in $ |
30,500 |
20,500 |
5,500 |
-5,000 |
-6,500 |
-7,500 |
|
Profit or loss in €2 |
28,499 |
19,155 |
5,139 |
-4,672 |
-6,073 |
-7,008 |
|
Profit or loss in £2 |
23,965 |
16,107 |
4,322 |
-3,929 |
-5,107 |
-5,893 |
|
Profit or loss in C$2 |
42,045 |
28,260 |
7,582 |
-6,893 |
-8,960 |
-10,339 |
- 1.00 lot is equivalent of 100 units
- Calculations for exchange rate used as of 09:27 (GMT+1) 14/06/2024
Fortrade recommends the use of Stop-Loss and Take-Profit, please speak to your Senior Account ManagerClient Manager regarding their use.
- You may wish to consider closing your position in profit, even if it is lower than suggested one
- Trailing stop technique can protect the profit – Ask your Senior Account ManagerClient Manager for more detail