Palladium weekly special report based on 1.00 Lot Calculation:
TECHNICAL ANALYSIS:
- UPTREND SINCE MAY 2025: As shown in the daily chart below, palladium has been in a steady uptrend, supported by a rising diagonal trendline (orange) since May. However, the price could decline.
- DAILY MOVING AVERAGES: Price is trading well above the 50-day (blue), and 100-day (green) moving averages, confirming strong bullish momentum and healthy trend structure.
- PALLADIUM HIT AN ALL-TIME HIGH OF $3,409 (March 2022): Palladium price has traded around $1200, and if a full recovery takes place, the price of palladium could see an upside of around 190%. Although the price could decline as well.
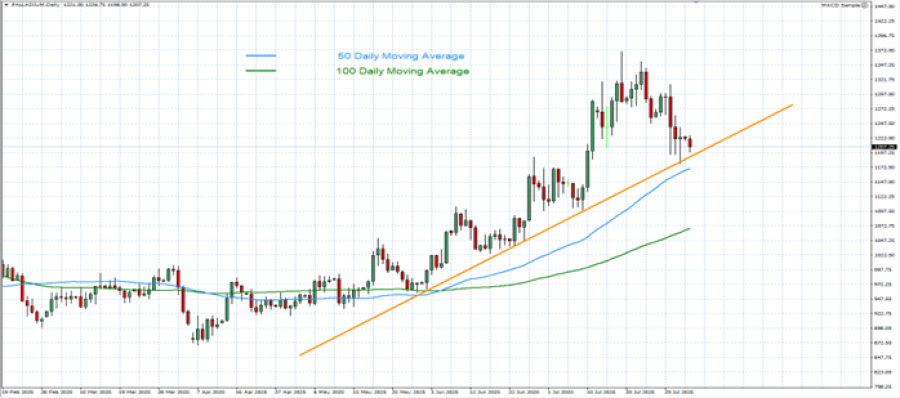
GRAPH (Daily): February 2025 – July 2025
Please note that past performance does not guarantee future results
GEOPOLITICS: RUSSIA – UKRAINE WAR
- EVENT (FRIDAY, AUGUST 8): U.S. THREATENS TARIFFS IF NO RUSSIA-UKRAINE DEAL IS REACHED BY AUGUST 8. U.S. President Trump wants a Russia-Ukraine ceasefire deal by August 8, warning of 100% secondary tariffs on countries importing Russian goods if no progress is made. This could be a major catalyst for palladium, as Russia supplies 43% of global output and 23% of global exports. New sanctions could trigger severe supply disruptions and support prices.
RUSSIAN IMPACT ON GLOBAL PALLADIUM MARKET SHARE:
- RUSSIA IS THE LARGEST PRODUCER IN THE WORLD
-
- ~43% OF TOTAL GLOBAL SUPPLY.
-
- RUSSIA IS THE LARGEST EXPORTER IN THE WORLD
-
- ~23% OF TOTAL GLOBAL EXPORTS.
-
PALLADIUM USE AND WORLD MARKET SHARE:
- Palladium is mostly used in catalytic converters by the car industry to reduce harmful gas emissions, while tightening regulations are forcing automakers to put more Palladium into each vehicle, which in turn could keep the demand outlook positive.
- MARKET SHARE (PRODUCERS): Russia is the largest producer, holding 43% of the market, while South Africa is the second largest with 33.00% of the market.
- MARKET SHARE (CONSUMERS): China is the largest Palladium consumer with 31%, while Europe and North America (USA) hold 20% each.
US-CHINA THIRD ROUND OF TRADE TALKS PROGRESS AND OPTIMISM
- EVENT (TUESDAY, AUGUST 12): US PRESIDENT TRUMP IS EXPECTED TO APPROVE 90-DAY TRUCE EXTENSION AFTER AUGUST 12. U.S. and Chinese officials wrapped up constructive trade talks in Stockholm and are expected to extend their 90-day tariff truce beyond the August 12 deadline. This is supportive for palladium demand, as easing trade tensions between the world’s two largest economies boosts the automotive production outlook, palladium’s key demand driver. A continued truce would help sustain positive sentiment and upside momentum in palladium prices.
EVENTS (CHINA):
- SATURDAY, AUGUST 9 AT 02:30 GMT+1: CHINA INFLATION (CPI) (JULY): A positive reading could reinforce optimism about China’s economic recovery and boost demand expectations for key industrial metals like palladium, which is heavily used in the automotive sector. (PREVIOUS: +0.1%)
Palladium, August 4, 2025.
Current Price: 1,200
|
PALLADIUM |
Weekly |
|
Trend direction |
|
|
1,500 |
|
|
1,370 |
|
|
1,290 |
|
|
1,120 |
|
|
1,110 |
|
|
1,100 |
Example of calculation based on weekly trend direction for 1.00 Lot1
|
PALLADIUM |
||||||
|
Pivot Points |
||||||
|
Profit or loss in $ |
30,000 |
17,000 |
9,000 |
-8,000 |
-9,000 |
-10,000 |
|
Profit or loss in €² |
25,953 |
14,707 |
7,786 |
-6,921 |
-7,786 |
-8,651 |
|
Profit or loss in £² |
22,587 |
12,799 |
6,776 |
-6,023 |
-6,776 |
-7,529 |
|
Profit or loss in C$² |
41,344 |
23,428 |
12,403 |
-11,025 |
-12,403 |
-13,781 |
- 1.00 lot is equivalent of 100 units
- Calculations for exchange rate used as of 11:30 (GMT+1) 4/08/2025
There is a possibility to use Stop-Loss and Take-Profit.
- You may wish to consider closing your position in profit, even if it is lower than the suggested one.
- Trailing stop techniques could protect the profit.