Palladium weekly special report based on 1.00 Lot Calculation:
TECHNICAL ANALYSIS:
- LONG-TERM UPTREND SINCE APRIL 2025: As shown in the daily chart below, palladium has been in a steady uptrend, supported by a rising diagonal trend line (orange) since April 2025. However, the price could decline.
- SUPPORT AREA: $1100 - $1050. Palladium prices have maintained a strong support zone between $1050 and $1100. However, there remains a risk of a potential breakout below this level if market conditions change.
- PALLADIUM HIT AN ALL-TIME HIGH OF $3,409 (March 2022): Palladium price has traded around $1160, and if a full recovery takes place, the price of palladium could see an upside of around 194%. Although the price could decline as well.
- PALLADIUM PRICE ABOVE 20-, 100-DAILY MOVING AVERAGE: Palladium price has remained above its 20- and 100– day moving averages, indicating a potential uptrend. The trend could reverse if Palladium price goes below these averages.
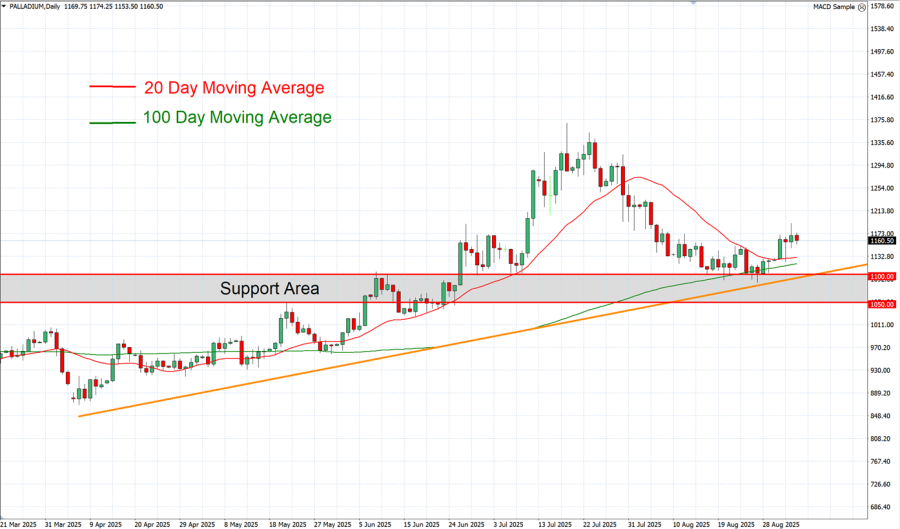
GRAPH (Daily): May 2025 – September 2025
Please note that past performance does not guarantee future results
EVENTS:
- FRIDAY, SEPTEMBER 5 AT 13:30 GMT+1: US NONFARM PAYROLLS (NFP) AND UNEMPLOYMENT RATE (AUGUST). U.S. Labor market data remains a key indicator for the Federal Reserve in assessing future rate cuts, with the unemployment rate holding above 4%, at 4.2% in July.
- MONDAY, SEPTEMBER 8 AT 15:53 GMT+1: TRADE BALANCE IN CHINA. A stronger-than-expected trade surplus—particularly if driven by resilient industrial demand and imports—could reinforce expectations of steady Chinese palladium demand, supporting prices and potentially extending the recent rebound. Conversely, a weaker outcome could pressure prices lower. China remains the world’s largest palladium consumer, making this data especially significant.
US FEDERAL RESERVE:
- WEDNESDAY, SEPTEMBER 17 AT 19:00 GMT+1: US FEDERAL RESERVE INTEREST RATE DECISION. Weaker July labour data, downward revisions to June, and Fed Chair Powell’s remarks at Jackson Hole have raised market expectations for a September rate cut. With the benchmark rate at 4.5% and projected to fall to 4% by end-2025, the U.S. dollar may face pressure, potentially supporting palladium prices.
GEOPOLITICS: TENSIONS RISE BETWEEN THE USA AND RUSSIA
- U.S. PRESIDENT DONALD TRUMP RENEWED HIS THREAT TO IMPOSE ECONOMIC PENALTIES ON RUSSIA. On August 26, 2025, Trump stepped up U.S. pressure on Russia, warning of “very serious” economic measures if the peace talks stalled. He stressed that the response would be economic, not military, implying Washington’s intent to rely on sanctions and tariffs rather than confrontation.
- RUSSIA IS THE LARGEST PALLADIUM PRODUCER IN THE WORLD AND THE LARGEST PALLADIUM EXPORTER IN THE WORLD. Russia is the largest palladium exporter (43%) and producer in the world (up to 23%).
Palladium, September 4, 2025.
Current Price: 1,160
|
PALLADIUM |
Weekly |
|
Trend direction |
|
|
1,400 |
|
|
1,300 |
|
|
1,225 |
|
|
1,100 |
|
|
1,090 |
|
|
1,080 |
Example of calculation based on weekly trend direction for 1.00 Lot1
|
PALLADIUM |
||||||
|
Pivot Points |
||||||
|
Profit or loss in $ |
24,000 |
14,000 |
6,500 |
-6,000 |
-7,000 |
-8,000 |
|
Profit or loss in €² |
20,605 |
12,020 |
5,581 |
-5,151 |
-6,010 |
-6,868 |
|
Profit or loss in £² |
17,855 |
10,415 |
4,836 |
-4,464 |
-5,208 |
-5,952 |
|
Profit or loss in C$² |
33,162 |
19,344 |
8,981 |
-8,290 |
-9,672 |
-11,054 |
- 1.00 lot is equivalent of 100 units
- Calculations for exchange rate used as of 11:30 (GMT+1) 4/09/2025
There is a possibility to use Stop-Loss and Take-Profit.
- You may wish to consider closing your position in profit, even if it is lower than suggested one.
- Trailing stop technique could protect the profit.