SILVER weekly special report based on 1.00 Lot Calculation:
GEOPOLITICS: MIDDLE EAST
- EVENT (FRIDAY, FEBRUARY 6): US-IRAN NUCLEAR TALKS IN OMAN. According to the latest reports, US and Iranian delegations will meet on Friday to seek a deal under which Iran would halt its nuclear program and missile production, according to the US side. However, reports suggest Iran may resist these terms, raising the risk of failure, as seen in June 2025 before the Israeli/US strikes on Iran.
- BREAKING (LATE JANUARY – EARLY FEBRUARY): US MILITARY ASSETS ARRIVED IN INTERNATIONAL WATERS NEAR IRAN AND ARE READY TO INTERVENE. The US “USS ABRAHAM LINCOLN” carrier and its group have arrived from to the Arabian Sea near the Gulf of Oman. Along the carrier the group is escorted with missile destroyers like the USS Spruance, USS Michael Murphy and USS Frank E Petersen. Now, Iranian targets are within the striking range of this battle group.
EVENTS
- WEDNESDAY, FEBRUARY 11 AT 13:30 GMT: US INFLATION DATA (CPI) (JANUARY). A low inflation print would reinforce the case for Fed rate cuts, putting negative pressure on the US dollar, while supporting gold prices. The headline CPI in the USA is currently at 2.7%, down from the recent 3%.
- TUESDAY, FEBRUARY 24: US PRESIDENT DONALD TRUMP AND HIS STATE OF THE UNION ADDRESS. President Trump will address a joint session of Congress marking a key yearly political event. Trump is likely to outline US administration successes so far and give a preview on plans for the rest of the year.
SILVER MARKET: HIGHER DEMAND AMID SUPPLY SHORTAGES LEADS TO A WIDENING DEFICIT
- MARKET DEFICIT: SILVER MARKET REMAINS IN DEFICIT SINCE AT LEAST 2016. The silver market faced a deficit of around 300 million ounces in 2025, according to recent reports from The Silver Institute. While the market has been in deficit since 2016, the gap has grown significantly since 2022.
- SUPPLY CONSTRAINTS: SILVER PRODUCTION REMAINS AROUND 800 MILLION OUNCES PER YEAR. Annual production has held near 800 million ounces, remaining largely unchanged since 2016. There is no clear indication that output will be meaningfully higher in 2026 or the following years.
- DEMAND REMAINS STRONG: SOLAR PANELS, ELECTRIC VEHICLES, AND A.I. INFRASTRUCTURE. Silver demand is expected to increase in 2026 and beyond due to rising demand from solar production, electric vehicles, and rapidly expanding A.I. data center infrastructure.
PRICE ACTION
- SILVER PRICE HIT A NEW ALL-TIME HIGH ON JANUARY 29, 2026 ($121.499). Silver currently trades around $91, and if it fully recovers to its previous all-time high, it could see an upside of around $31. However, the price could also decline.
- ANALYSTS’ OPINION: Citigroup forecasts $150;
TECHNICAL ANALYSIS
- LONG-TERM TREND IS UP. The overall trend of silver is up (black trendline), with the trend accelerating since November of 2025.
- SUPPORT AREA: $80 – $70. After the most recent downward price correction that took place in late January 2026, silver prices have found a support zone in the range between $80and $70.
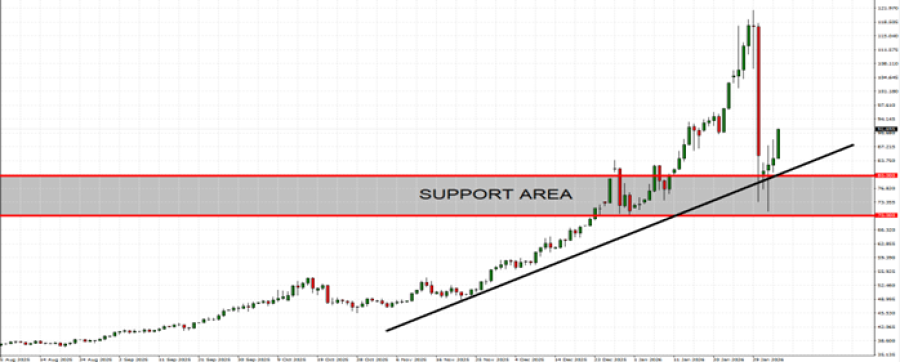
GRAPH (Daily): August 2025 – February 2026
Please note that past performance does not guarantee future results
SILVER, February 04, 2026
Current Price: 91
|
SILVER |
Weekly |
|
Trend direction |
|
|
150 |
|
|
130 |
|
|
105 |
|
|
80 |
|
|
77 |
|
|
75 |
Example of calculation base on weekly trend direction for 1.00 Lot1
|
SILVER |
||||||
|
Pivot Points |
||||||
|
Profit or loss in $ |
590,000 |
390,000 |
140,000 |
-110,000 |
-140,000 |
-160,000 |
|
Profit or loss in €2 |
499,420 |
330,125 |
118,506 |
-93,112 |
-118,506 |
-135,436 |
|
Profit or loss in £2 |
430,318 |
284,447 |
102,109 |
-80,229 |
-102,109 |
-116,696 |
|
Profit or loss in C$2 |
805,385 |
532,373 |
191,108 |
-150,157 |
-191,108 |
-218,410 |
- 1.00 lot is equivalent of 10,000 units
- Calculations for exchange rate used as of 13:40 (GMT) 04/02/2026
There is a possibility to use Stop-Loss and Take-Profit.
- You may wish to consider closing your position in profit, even if it is lower than suggested one.
- Trailing stop technique could protect the profit.