Taiwan Semiconductor (#TAIWANSM) Weekly Special Report based on 1.00 Lot Calculation:
CHIP INDUSTRY:
- TAIWAN MARKET SHARE (2024): According to TechInAsia and Wccftech, Taiwan Semiconductor's market share was 68% in Q1 2025, followed by Samsung (12%).
THE COMPANY:
- Taiwan Semiconductor is a global leader in semiconductor fabrication and makes the vast majority of the world’s leading-edge logic chips, used in emerging technologies such as artificial intelligence. Its focus on areas such as artificial intelligence and automotive technology positions the company as a strategic partner for innovative companies seeking cutting-edge solutions.
- DEPENDENCE OF LARGE TECHNOLOGY COMPANIES: Nvidia is one of Taiwan Semiconductor´s main customers. Of Taiwan Semiconductor revenues, about 13% is contributed by Nvidia, 22% by Apple, 5.2% by Qualcomm, 4.6% by AMD, 4.3% by Broadcom, and 4% by Amazon. In other words, more than 50% of Taiwan Semiconductor´s sales come from large and well-known customers (Apple, Nvidia, Amazon, Broadcom, AMD, and Qualcomm).
NEWS:
- BREAKING (OCTOBER 09): SEPTEMBER MONTHLY SALES REPORT. Taiwan Semiconductor discloses its revenues monthly. September revenue came in at $10.9 billion, exceeding market expectations for $9.94 billion.
EVENTS:
- EVENT (THURSDAY, OCTOBER 16, PREMARKET): Q3 EARNINGS REPORT. Taiwan Semiconductor is expected to print $31.52 billion in revenue for Q3 of 2025. This is an increase of 34% from the same period last year ($23.52 billion). In addition, the company is expected to post net earnings of $13.16 billion, which would be an increase of around 31% from the same period last year ($10.07).
- LAST TIME (Q2 EARNINGS RELEASED ON July 17, 2025, PREMARKET): Taiwan Semiconductor reported a higher-than-expected revenue figure ($31.7 billion vs. $31.62 billion expected) and better-than-expected net income figures ($13.52 billion vs. $12.83 billion expected) (Source: CNBC).
- LAST 8 QUARTERS: TAIWAN SEMICONDUCTOR TENDS TO BEAT REVENUE AND EARNINGS FORECASTS. According to Bloomberg, Taiwan Semiconductor has beaten earnings and revenue estimates 8 times over the last 8 quarters.
PRICE ACTION:
- TAIWAN SEMICONDUCTOR STOCK PRICE HIT AN ALL-TIME HIGH OF $306.56 (October 6, 2025). The stock price has risen by around 53% since the start of 2025.
- ANALYSTS’ OPINION: HSBC forecasts $363.05; Barclays forecasts $330; Goldman Sachs forecasts $320; Aletheia Capital forecasts $450;
TECHNICAL ANALYSIS:
- UPTREND CHANNEL: The black uptrend channel depicted by the chart below shows that Taiwan Semiconductor prices have maintained their uptrend in general since April 2025. However, there remains a risk of a potential breakout below this level if market conditions change.
- WEEKLY MOVING AVERAGES POINT TO UPTREND: Taiwan Semiconductor has recently traded above the 20- and 50-week moving averages, pointing to an ongoing uptrend. However, Taiwan Semiconductor price can change its trend if prices fall below the 20- and 50-week moving averages.
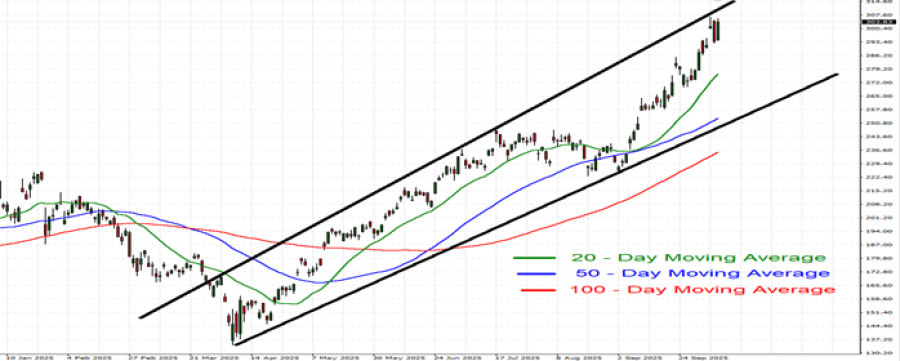
GRAPH (Daily): January 2025 – October 2025
Please note that past performance does not guarantee future results
#TAIWANSM, October 9, 2025.
Current Price: 303
|
TAIWANSM |
Weekly |
|
Trend direction |
|
|
400 |
|
|
363 |
|
|
330 |
|
|
280 |
|
|
270 |
|
|
260 |
Example of calculation based on weekly trend direction for 1 Lot1
|
TAIWANSM |
||||||
|
Pivot Points |
||||||
|
Profit or loss in $ |
97,000 |
60,000 |
27,000 |
-23,000 |
-33,000 |
-43,000 |
|
Profit or loss in €2 |
83,583 |
51,701 |
23,265 |
-19,819 |
-28,435 |
-37,052 |
|
Profit or loss in £2 |
72,540 |
44,870 |
20,191 |
-17,200 |
-24,678 |
-32,157 |
|
Profit or loss in C$2 |
135,282 |
83,680 |
37,656 |
-32,077 |
-46,024 |
-59,970 |
- 1.00 lot is equivalent of 1000 units
- Calculations for exchange rate used as of 13:12 (GMT+1) 09/10/2025
There is a possibility to use Stop-Loss and Take-Profit
- You may wish to consider closing your position in profit, even if it is lower than suggested one.
- Trailing stop technique could protect the profit.