Tesla (#TSLA) weekly special report based On 1 Lot Calculation:
GLOBAL EV MARKETS:
- ELECTRIC VEHICLES (EV) MADE ONLY AROUND 9.0% OF TOTAL CAR SALES, WORTH 66.7 MILLION CARS IN 2022: The EV sector increased its market share from 4.11% in 2021 to around 9.00% off the global car sales in 2022.
- MARKET POTENTIAL: ELECTRIC VEHICLES (EV) COULD BE EXPECTED TO TAKE UP AROUND 50% OF GLOBAL CAR SALES BY 2030. The 2021 figures of 287.36 billion dollars are an increase of around 76% from 2020’s 160.01 billion dollars. Expecting this number to grow to 823.75 billion dollars, the EV market could be growing annually on average by 18.6%.
TESLA: EVENTS AND ANALYSIS
- EVENT: Q3 CAR DELIVERY REPORT (EXPECTED: OCTOBER 1- 5): Q2 CAR DELIVERY. Tesla delivered a new quarterly record when it released 466,140 cars delivered in Q2, beating Q1 2023 record of 422,875. Still the company is expected to deliver 1.8-1.9 million cars in 2023, which would be 37% to 44.6% up from 2022.
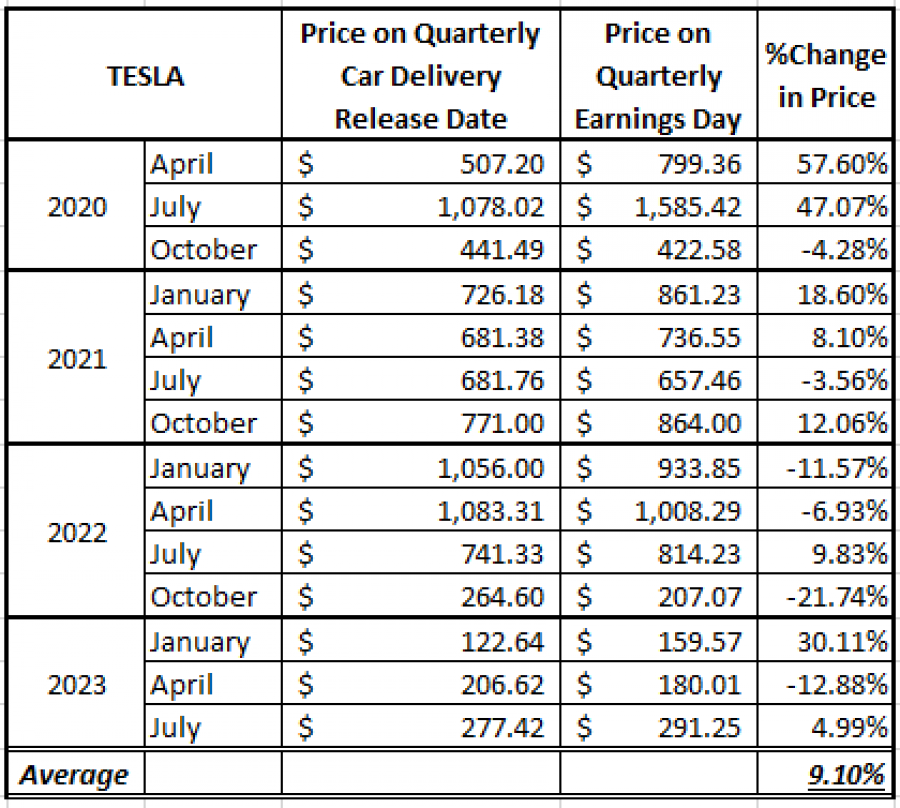
- STATISTICS (2020- 2023) (TABLE I): TESLA STOCK RISES ON AVERAGE 9.10% BETWEEN QUARTERLY DELIVERY DATE AND QUARTERLY EARNINGS DATE.
TABLE I: TESLA STOCK PRICE ACTION BETWEEN DELIVERY AND EARNINGS DATES (2020- 2023) *

DATA SOURCE 1: BLOOMBERG
DATA SOURCE 2: FORTRADE METATRADER 4
Please note that past performance does not guarantee future results.
_______________________________________________________________________________________________
*- Note that prices are not adjusted for stock splits
TESLA: OTHER ANALYSIS
- TESLA AGAIN CONSIDERING TO ENTER THE INDIAN MARKET: Reportedly, the company is in talks with the Indian officials to build a factory there.
- TESLA CONSIDERING TO BUILD A GIGAFACTORY IN SPAIN: Tesla is reportedly considering building a new factory in Valencia, Spain, that could be worth close to 5 billion dollars.
- TESLA IS CONSIDERING A NEW MODEL (MODEL 2): The model is expected to be the cheapest ever offered by Tesla, in a range between 20,000 and 25,000 dollars. The reports say that new Gigafactories to be built will incorporate technologies to produce the new model.
- CYBERTRUCK (PICK-UP) COMING IN THE SECOND HALF OF 2023. Elon Musk said he expects the Tesla Cybertruck to sell between 250,000 and 500,000 units per year once production is fully ramped.
TESLA: PRICE ACTION
- THE STOCK HAS TRADED AROUND 41% BELOW ITS ALL- TIME HIGH OF $414.4 (November 4, 2021). Tesla was last trading around $244, and if a full recovery follows to recent all- time highs, the stock could see an upside of around 70%. However the price could decline further.
- ANALYSTS OPINIONS: Wedbush forecasts $350. New Street Research forecasts $350. RBC Capital forecasts $305. Muziho forecasts $330. Deutsche Bank forecasts $300.
#TSLA, September 25, 2023
Current Price:244
|
Tesla |
Weekly |
|
Trend direction |
|
|
315 |
|
|
295 |
|
|
270 |
|
|
220 |
|
|
215 |
|
|
210 |
Example of calculation based on weekly trend direction for 1 Lot1
|
Tesla |
||||||
|
Pivot Points |
||||||
|
Profit or loss in $ |
71,000.00 |
51,000.00 |
26,000.00 |
-24,000.00 |
-29,000.00 |
-34,000.00 |
|
Profit or loss in €2 |
66,756.30 |
47,951.71 |
24,445.97 |
-22,565.51 |
-27,266.66 |
-31,967.81 |
|
Profit or loss in £2 |
58,024.55 |
41,679.61 |
21,248.43 |
-19,613.93 |
-23,700.17 |
-27,786.40 |
|
Profit or loss in C$2 |
95,675.34 |
68,724.54 |
35,036.04 |
-32,340.96 |
-39,078.66 |
-45,816.36 |
1. 1.00 lot is equivalent of 1000 units
2. Calculations for exchange rate used as of 09:00 (GMT+1) 25/09/2023
Fortrade recommends the use of Stop-Loss and Take-Profit, please speak to your Senior Account ManagerClient Manager regarding their use.
- You may wish to consider closing your position in profit, even if it is lower than suggested one
- Trailing stop technique can protect the profit – Ask your Senior Account ManagerClient Manager for more detail