Tesla (#TSLA) weekly special report based On 1 Lot Calculation:
GLOBAL EV MARKETS:
- ELECTRIC VEHICLES (EV) MADE ONLY AROUND 9.0% OF TOTAL CAR SALES, WORTH 66.7 MILLION CARS IN 2022: The EV sector increased its market share from 4.11% in 2021 to around 9.00% off the global car sales in 2022.
- MARKET POTENTIAL: ELECTRIC VEHICLES (EV) COULD BE EXPECTED TO TAKE UP AROUND 50% OF GLOBAL CAR SALES BY 2030. The 2021 figures of 287.36 billion dollars are an increase of around 76% from 2020’s 160.01 billion dollars. Expecting this number to grow to 823.75 billion dollars, the EV market could be growing annually on average by 18.6%.
EV MARKET SHARE IN THE U.S.:
- Tesla: 60%
- Ford and General Motors: 10%
- Others: 30%
Source: Barrons.com
GLOBAL EV (all-electric car) MARKET SHARE:
- Tesla: 23.6%
- BYD Auto: 14.7%
- Volkswagen: 7.5%
- SAIC: 7.4%
- Geely- Volvo: 5.7%
- Others: 41.1%
Source: insideevs.com
TESLA: EVENTS AND ANALYSIS
- TESLA LAUNCHED ITS LATEST PRODUCT: CYBERTRUCK (NOVEMBER 30, 2023). According to Bloomberg, the Cybertruck comes in three configurations: rear-wheel drive, all-wheel drive and the so-called Cyberbeast. The cheapest version of the Cybertruck will cost $60,990, which is more than 50% over the price Musk floated when he announced the vehicle in 2019. That version, a rear-wheel drive model with a battery range of 250 miles, won’t be available until 2025. Tesla is offering delivery next year for the two more expensive models, including the Cyberbeast, which has a price tag of nearly $100,000. EXPECTED DELIVERY IN 2024: 100,000 to 120,000. Analysts believe that Tesla could deliver 100,000 or more Cybertrucks in 2024, and at least 240,000 in 2025.
- STATISTICS (HISTORICAL): TESLA STOCK PRICE WITHIN A MONTH AFTER A NEW MODEL LAUNCHED.
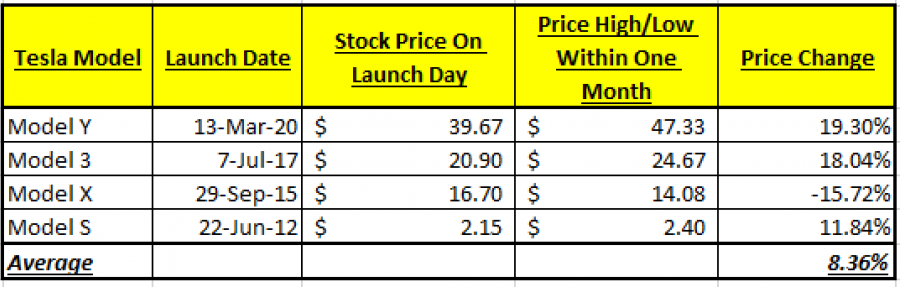
Data Source: Bloomberg
*- Prices Have Been Adjusted For Recent Stock Splits
Please note that past performance does not guarantee future results.
- EVENT (EXPECTED: JANUARY 1-5): Q4 CAR DELIVERY DATA. Tesla delivered 435,059 cars in Q3. This was down from its Q2 record when it released 466,140 cars, beating Q1 2023 record of 422,875. Still the company is expected to deliver 1.8-1.9 million cars in 2023, which would be 37% to 44.6% up from 2022.
TESLA: PRICE ACTION
- THE STOCK HAS TRADED BELOW ITS ALL- TIME HIGH OF $414.4 (November 4, 2021). Tesla was last trading around $235, and if a full recovery follows to recent all- time highs, the stock could see an upside of around 76%. However, the price could decline further.
- ANALYSTS OPINIONS: Morgan Stanley forecasts $380. Wedbush forecasts $310. RBC Capital forecasts $301. Muziho forecasts $310. Barclays forecasts $260.
#TSLA, December 1, 2023
Current Price:235
|
Tesla |
Weekly |
|
Trend direction |
|
|
380 |
|
|
310 |
|
|
260 |
|
|
210 |
|
|
205 |
|
|
200 |
Example of calculation based on weekly trend direction for 1 Lot1
|
Tesla |
||||||
|
Pivot Points |
||||||
|
Profit or loss in $ |
145,000.00 |
75,000.00 |
25,000.00 |
-25,000.00 |
-30,000.00 |
-35,000.00 |
|
Profit or loss in €2 |
133,104.45 |
68,847.13 |
22,949.04 |
-22,949.04 |
-27,538.85 |
-32,128.66 |
|
Profit or loss in £2 |
114,617.26 |
59,284.79 |
19,761.60 |
-19,761.60 |
-23,713.92 |
-27,666.23 |
|
Profit or loss in C$2 |
196,084.95 |
101,423.25 |
33,807.75 |
-33,807.75 |
-40,569.30 |
-47,330.85 |
1. 1.00 lot is equivalent of 1000 units
2. Calculations for exchange rate used as of 09:10 (GMT) 01/12/2023
Fortrade recommends the use of Stop-Loss and Take-Profit, please speak to your Senior Account ManagerClient Manager regarding their use.
- You may wish to consider closing your position in profit, even if it is lower than suggested one
- Trailing stop technique can protect the profit – Ask your Senior Account ManagerClient Manager for more detail