US STOCK MARKETS
-
STOCK MARKET TREND DEFINITION
BULL MARKET: DEFINITION. While bear markets signal a time of pessimism and economic decline, a bull market is defined by optimism and economic growth. A bull market is a period when stock prices are rising and investor sentiment is positive. During a bull market, stocks in a broad market index increase in value by 20% or more from recent bottom. According to First Trust, the average bull market period lasted 6.6 years with an average cumulative total return of 339%.
BEAR MARKET: DEFINITION. According to Forbes, economists define a bear market as a decline of 20% or more of a major stock market index, such as the NASDAQ 100, for a sustained period. SENTIMENT: During a bear market, market sentiment is poor. Investors are pessimistic about the stock market’s prospects, making them more likely to sell Instrument than hold them.
Table I: Bear and Bull Market Characteristics
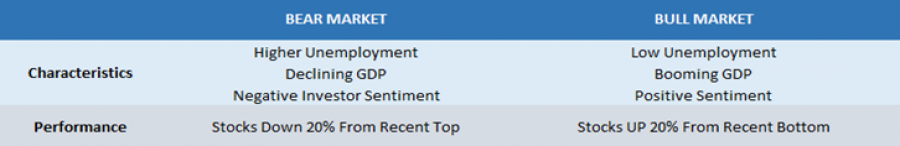
Data Source: Forbes
USA100 INDEX
-
THE USA100 INDEX: TRANSITION FROM BEAR TO BULL MARKET
BEAR MARKET CONFIRMED in April, 2022. The Index fell 20% from 16,765.87 (November 21, 2021) to 13,412.70 (April 22, 2022). The market was there for 11- 12 months, having a maximum drop of 37.46% (October 13, 2022).
BEAR MARKET BOTTOM: October 13, 2022. The Index fell to 10,484.68 by October 13, 2022, marking a total decline of 37.46% from its recent top of 16,765.87 (November 21, 2021).
INDEX HAS RISEN MORE THAN 20% FROM RECENT BOTTOM TO ENTER A NEW BULL MARKET (5 Months): March 16, 2023. The index currently trades around 15,490, which is up by around 48% since the October 2022 bottom. If a full recovery followed to its recent all-time high, this could be an upside of additional 8%. However, it could also decline. The new bull market is considered to have developed due to the rise of Artificial Intelligence, led by Nvidia.
However, please note that past performance does not guarantee future results.
-
PERFORMANSE BULL MARKET DRIVEN BY NEW TECHNOLOGICAL INNOVATIONS IN PAST:
ERA: Dotcom
PERIOD: 1995- 2000
MEANING: The dotcom bubble was a rapid rise in U.S. technology stock equity valuations fueled by investments in Internet-based companies during the bull market in the late 1990s.
USA100 PERFORMANCE: UP more than 400% from 1995 to 2000.
Source: Investopedia
However, please note that past performance does not guarantee future results.
-
NEXT EVENTS:
US INFLATION FOR AUGUST - (WEDNESDAY, SEPTEMBER 13 AT 13:30 GMT+1). According to Bloomberg, US Inflation in August is expected to see an increase from 3.2% to 3.5%. Core Inflation, however, is expected to show a decrease to 4.3% in August from previous 4.7%.
FEDERAL RESERVE INTEREST RATE DECISION (WEDNESDAY, SEPTEMBER 20 AT 19:00 GMT+1). According to the CMEGROUP.COM, market participants give a 93%* chance that the US Federal Reserve will keep its benchmark interest rate unchanged at 5.50%.
*-https://www.cmegroup.com/markets/interest-rates/cme-fedwatch-tool.html
USA100, September 4, 2023
Current Price: 15,490
|
USA100 |
Weekly |
|
Trend direction |
|
|
17,800 |
|
|
17,000 |
|
|
16,300 |
|
|
14,800 |
|
|
14,500 |
|
|
14,200 |
Example of calculation based on weekly trend direction for 1 Lot1
|
USA100 |
||||||
|
Pivot Points |
||||||
|
Profit or loss in $ |
23,070 |
15,070 |
8,070 |
-6,930 |
-9,930 |
-12,930 |
|
Profit or loss in €2 |
21,365 |
13,956 |
7,474 |
-6,418 |
-9,196 |
-11,974 |
|
Profit or loss in £2 |
18,269 |
11,934 |
6,391 |
-5,488 |
-7,863 |
-10,239 |
|
Profit or loss in C$2 |
31,375 |
20,495 |
10,975 |
-9,425 |
-13,505 |
-17,585 |
1. 1.00 lot is equivalent of 10 units
2. Calculations for exchange rate used as of 10:20 (GMT+1) 04/09/2023
Fortrade recommends the use of Stop-Loss and Take-Profit, please speak to your Senior Account ManagerClient Manager regarding their use.
-
You may wish to consider closing your position in profit, even if it is lower than suggested one
-
Trailing stop technique can protect the profit – Ask your Senior Account ManagerClient Manager for more detail