Crude Oil weekly special report based on 1.00 Lot Calculation:
TECHNICAL ANALYSIS:
- LONG-TERM SUPPORT AREA BELOW THE PSYCHOLOGICAL MARK OF $60: Crude oil price has recently tested levels below $60, which has been acting as a support area since early 2021.
- 4 - YEAR AVERAGE DAILY PRICE (MAY 2021 – MAY 2025): $79.60. The Crude Oil average price in the period between May 2021 and 2025, which includes the Russia-Ukraine war, has been $79.60. (Source: Meta Trader 4)
- BREAKING (MAY 5): CRUDE OIL PRICES TESTED THE LEVEL OF $55.36. After testing the mark of $55.36, Crude oil prices managed to recover and hit $64.140 on May 20 (Data Source: MetaTarder 4).
- BREAKING (APRIL 9): CRUDE OIL PRICES HIT THEIR LOWEST LEVEL SINCE FEBRUARY 2021 ($55.115): Crude oil prices fell to their lowest in more than four years to hit the level of $55.115 on April 9. After testing the mark of $55.115, Crude oil prices managed to recover and hit $64.845 on April 23 (Data Source: MetaTarder 4).
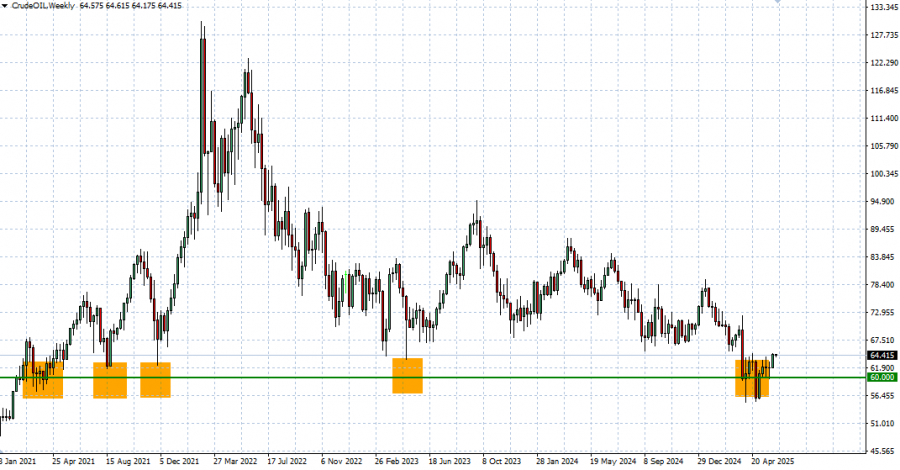
GRAPH (Weekly): February 2021 – June 2025
Please note that past performance does not guarantee future results
GLOBAL TRADE:
- EVENT (MONDAY (June 9)): U.S.-CHINA TRADE TALKS BEGIN IN LONDON. Vice Premier He Lifeng is visiting the UK from June 9–13 and will chair the first meeting of the U.S.–China Economic and Trade Consultation Mechanism, according to China’s Foreign Ministry. President Trump confirmed that Treasury Secretary Scott Bessent, Commerce Secretary Howard Lutnick, and USTR Representative Jamieson Greer will meet with the Chinese delegation in London on June 9 to discuss a trade deal.
GEOPOLITICS:
- US - IRAN NUCLEAR TALKS IN JEOPARDY: US PRESIDENT TRUMP ULTIMATUM TO IRAN EXPIRES THIS WEEK; U.S. STILL WAITING FOR IRAN’S RESPONSE TO THE U.S. PROPOSAL. Trump's two-month deadline for a deal will expire this week, according to the White House's interpretation of that timeline. In March, President Trump's letter to Iran's Supreme Leader Ali Khamenei included a two-month deadline for reaching a new nuclear deal, which began ticking out when negotiations began in April. The two countries have held five rounds of Omani-mediated talks since April, with no breakthrough progress announce yet. Meanwhile, Iranian officials said the response to the U.S. last proposal, which was already condemned by Iran’s Supreme Leader Ali Khamenei is now being drafted.
EVENTS (OIL):
- TUESDAY, JUNE 10 AT 21:30 GMT+1: AMERICAN PETROLEUM INSTITUTE (API) WEEKLY OIL INVENTORY DATA (USA). If data showed a declining inventory for the past week, then positive support for the oil price could be expected. However, the price could decline.
- WEDNESDAY, JUNE 11 AT 15:30 GMT+1: ENERGY INFORMATION ADMINISTRATION (EIA) OIL INVENTORY DATA (USA). If data showed a declining inventory for the past week, then positive support for the oil price could be expected. However, the price could decline.
Crude Oil, June 09, 2025
Current Price: 64.20
|
Crude Oil |
Weekly |
|
Trend direction |
|
|
72.00 |
|
|
69.00 |
|
|
67.00 |
|
|
61.50 |
|
|
61.00 |
|
|
60.00 |
Example of calculation based on weekly trend direction for 1.00 Lot1
|
Crude Oil |
||||||
|
Pivot Points |
||||||
|
Profit or loss in $ |
7,800 |
4,800 |
2,800 |
-2,700 |
-3,200 |
-4,200 |
|
Profit or loss in €² |
6,829 |
4,202 |
2,451 |
-2,364 |
-2,802 |
-3,677 |
|
Profit or loss in £² |
5,749 |
3,538 |
2,064 |
-1,990 |
-2,359 |
-3,096 |
|
Profit or loss in C$² |
10,669 |
6,566 |
3,830 |
-3,693 |
-4,377 |
-5,745 |
- 1.00 lot is equivalent of 1000 units
- Calculations for exchange rate used as of 09:15 (GMT) 09/06/2025
There is a possibility to use Stop-Loss and Take-Profit.
- You may wish to consider closing your position in profit, even if it is lower than the suggested one.
- Trailing stop techniques could protect the profit.