USA100 Weekly Special Report based on 1.00 Lot Calculation:
- WHAT IS A STOCK INDEX: According to Investopedia.com, a stock index measures the price performance of a basket (group) of stocks using a standardized methodology. The NASDAQ 100 Index is one of the world's best-known indexes and one of the most commonly used benchmarks for the stock market.
- COMPONENTS: USA100 includes 100 companies such as Amazon, Google, Nvidia, Meta, and Microsoft.
- KEY CONSTITUENTS CONTINUE STRONG PERFORMANCE IN 2024:
- NVIDIA +164.49%
- GOOGLE +26.88%
- AMAZON +21.14%
- META +43.13%
- MICROSOFT +19.23%
*Note, price appreciation uses closing prices as of 17 June, 2024
Also, please note that past performance does not guarantee future results.
Analysis:
- THE NASDAQ BULL RUN CONTINUES, WITH THE MARKET NOW UP 87.75% FROM ITS OCTOBER 2022 LOWS: The Nasdaq has sharply rallied from October 2022 lows, as the tech sector continues to remain the best performing sector in the United States. The Nasdaq rally has outpaced both the S&P500 and the Dow Jones Industrial index since October 2022.
- USA100 BULL RUN OCTOBER 2022 TO JUNE 2024 –
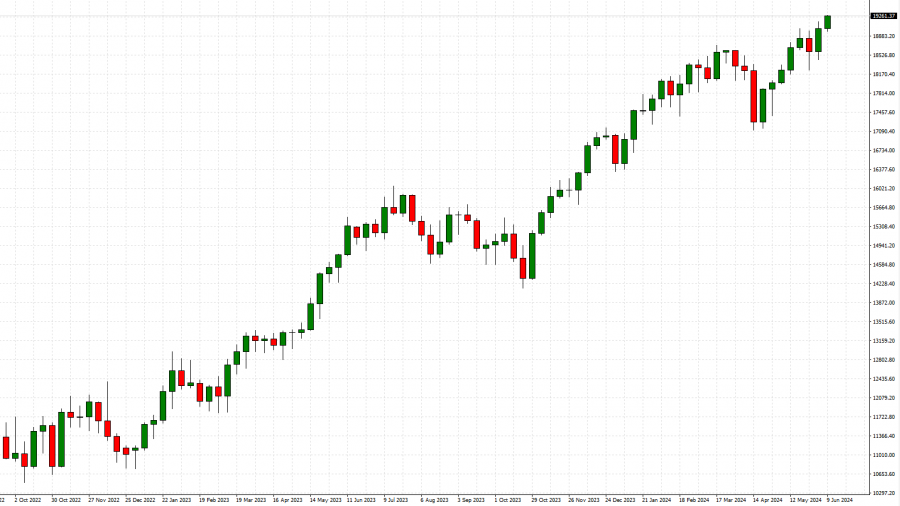
Source: MetaTrader 4 Platform
MOST RECENT BULL MARKETS
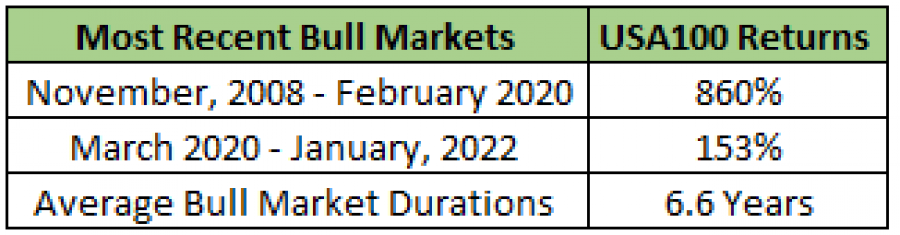
Data Source I: MetaTrader
Data Source II: First Trust
Please note that past performance does not guarantee future results
- ANALYST OPINION: ACCORDING TO BLOOMBERG, THE ANALYST PRICE TARGET CONSENSUS ON THE USA100 IS AROUND 20,940.
USA100, JUNE 18, 2024
Current Price: 20,200
|
USA100 |
Weekly |
|
Trend direction |
|
|
22,000 |
|
|
21,500 |
|
|
20,940 |
|
|
19,600 |
|
|
19,400 |
|
|
19,200 |
Example of calculation base on weekly trend direction for 1.00 Lot1
|
USA100 |
||||||
|
Profit or loss in $ |
18,000.00 |
13,000.00 |
7,400.00 |
-6,000.00 |
-8,000.00 |
-10,000.00 |
|
Profit or loss in €² |
16,788.96 |
12,125.36 |
6,902.13 |
-5,596.32 |
-7,461.76 |
-9,327.20 |
|
Profit or loss in £² |
14,192.34 |
10,250.02 |
5,834.63 |
-4,730.78 |
-6,307.71 |
-7,884.63 |
|
Profit or loss in C² |
24,751.17 |
17,875.85 |
10,175.48 |
-8,250.39 |
-11,000.52 |
-13,750.65 |
1. 1.00 lot is equivalent of 10 units
2. Calculations for exchange rate used as of 10:20 (GMT+1) 18/06/2024
Fortrade recommends the use of Stop-Loss and Take-Profit, please speak to your Senior Account ManagerClient Manager regarding their use.
- You may wish to consider closing your position in profit, even if it is lower than suggested one
- Trailing stop technique can protect the profit – Ask your Senior Account ManagerClient Manager for more detail