USA100 Weekly Special Report based on 1.00 Lot Calculation:
USA100 INDEX:
- WHAT IS A STOCK INDEX: According to Investopedia.com, a stock index measures the price performance of a basket (group) of stocks using a standardized methodology. The NASDAQ 100 Index is one of the world's best-known indexes and one of the most commonly used benchmarks for the stock market.
- COMPONENTS: USA100 includes 100 companies, many of them dealing with tech and A.I., such as Apple, Google, ARM, Nvidia, Meta, Microsoft, Amazon, etc.
GEOPOLITICS: US TRADE NEGOTIATIONS HAVE BEGUN
- BREAKING (MONDAY, MAY 12): U.S. AND CHINA AGREED TO REDUCE TARIFFS ON EACH OTHER FOR THE NEXT 90 DAYS. United States cuts tariffs on Chinese goods from 145% to 30% for 90 days. China lowers tariffs from 125% to 10% for all US products next 90 days.
U.S. Q1 EARNINGS SEASON (April 11 – May 15):
- USA100 INDEX COMPANIES DURING THE LAST 10 QUARTERLY EARNINGS SEASONS: 79% OF THE COMPANIES ON AVERAGE HAVE BEAT EARNINGS ESTIMATES. When a company exceeds earnings expectations, this could indicate stronger-than-anticipated performance, boosting investor confidence.
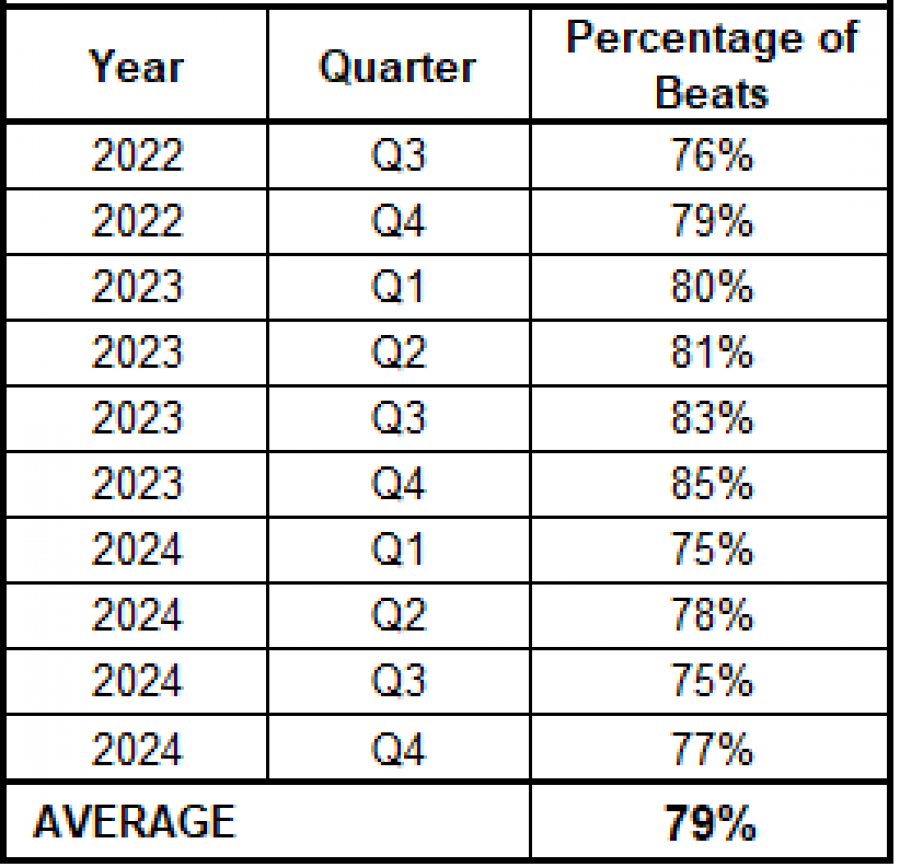
Data Source: factset.com
Please note that past performance does not guarantee future results
Q1 EARNINGS CALENDAR: Q1 Earnings Report dates for some of the most known tech companies in the world
- NVIDIA: 28/05/2025 – AFTERMARKET
U.S.: EVENTS
- EVENT (TUESDAY, MAY 13 AT 13:30 GMT+1): US INFLATION (CPI) (APRIL). A lower-than-expected reading could be positive for US Stocks, as it will motivate the FED to cut interest rates more aggressively. The CPI Index measures the change in the price of goods and services from the perspective of the consumer. US Annual Headline Inflation (CPI) came in at 2.4% in March, down from February’s data (2.8%).
PRICE ACTION:
- USA100 INDEX HIT AN ALL-TIME HIGH OF 22,448.90 (DECEMBER 16, 2024). The index has traded around 20,900, and if a full recovery takes place, the price of USA100 could rise around 7%. However, the price could decline in value.
- USA100 HAS TESTED ITS LOWEST PRICE IN 15 MONTHS (16,459). The index has recently retreated from its all-time high of 22,448.90, hitting its lowest rate in 15 months, on April 6, 2025 (16,459).
USA100, May 12, 2025
Current Price: 20,900
|
USA100 |
Weekly |
|
Trend direction |
|
|
23,500 |
|
|
22,450 |
|
|
21,600 |
|
|
20,200 |
|
|
20,000 |
|
|
19,800 |
Example of calculation based on weekly trend direction for 1.00 Lot1
|
USA100 |
||||||
|
Profit or loss in $ |
26,000 |
15,500 |
7,000 |
-7,000 |
-9,000 |
-11,000 |
|
Profit or loss in €² |
23,427 |
13,966 |
6,307 |
-6,307 |
-8,109 |
-9,911 |
|
Profit or loss in £² |
19,754 |
11,776 |
5,318 |
-5,318 |
-6,838 |
-8,357 |
|
Profit or loss in C² |
36,348 |
21,669 |
9,786 |
-9,786 |
-12,582 |
-15,378 |
- 1.00 lot is equivalent of 10 units
- Calculations for exchange rate used as of 09:50 (GMT+1) 12/05/2025
There is a possibility to use Stop-Loss and Take-Profit.
- You may wish to consider closing your position in profit, even if it is lower than suggested one.
- Trailing stop technique could protect the profit.