USA100 Weekly Special Report based on 1.00 Lot Calculation:
USA100:
- USA100 represents the Nasdaq 100, which includes 100 of the largest and most innovative non-financial companies listed on the Nasdaq exchange. It features global tech and AI leaders such as Apple, Google, ARM, Nvidia, Meta, Microsoft, Amazon, and others. In essence, USA100 reflects the strength and evolution of the modern digital economy in the United States.
EVENTS:
- FRIDAY, JUNE 6, AT 13:30 GMT+1: US NONFARM PAYROLLS (NFP) AND UNEMPLOYMENT RATE (MAY): In April, NFP came in at 177,000, while the unemployment rate held steady at 4.2%, the same as in March. If the unemployment rate continues its upward trend (4.0% in January, 4.1% in February, and 4.2% in March and April), it could weaken the US dollar, potentially supporting higher palladium prices.
- EXPECTED WEEK ENDING JUNE 9: US PRESIDENT DONALD TRUMP TO SPEAK WITH CHINA PRESIDENT XI. President Donald Trump and Chinese President Xi Jinping are likely to speak this week, a senior White House official told CNBC on Monday (June 2). The discussion would follow a series of recent flare-ups between Washington and Beijing that threaten to derail a tentative trade agreement between the two economic superpowers.
- JUNE 9 – JUNE 13: APPLE WORLDWIDE DEVELOPERS CONFERENCE (WWDC) 2025. Apple’s WWDC 2025 will showcase major software updates with a strong AI focus. Highlights include a unified OS naming system (iOS 26, macOS 26, etc.), a new “Solarium” interface inspired by visionOS, and a dedicated gaming app combining Game Center and Apple Arcade. While the Siri AI update is delayed, Apple continues to expand AI integration across its ecosystem, supporting long-term product value and stock outlook.
Apple is currently the third-largest company within the USA100, with a weight of approximately 11%.
TECHNICAL ANALYSIS:
- LONGER-TERM TREND LINE: The black trend line depicted by the chart below shows that USA100 prices have maintained their uptrend in general since April 2025.
- 14-DAY RELATIVE STRENGTH INDEX (RSI) STAYS ABOVE 50: The chart below shows that the 14-day relative strength index (RSI) remains in an uptrend, floating above the break-even point of 50, towards the upper limit of 70, before it tries to enter an oversold territory and potentially change its trend.
- USA100 INDEX HIT AN ALL-TIME HIGH OF 22,448.90 (DECEMBER 16, 2024). The index has traded around 21,750, and if a full recovery takes place, the price of USA100 could rise around 3.2%. However, the price could decline in value.
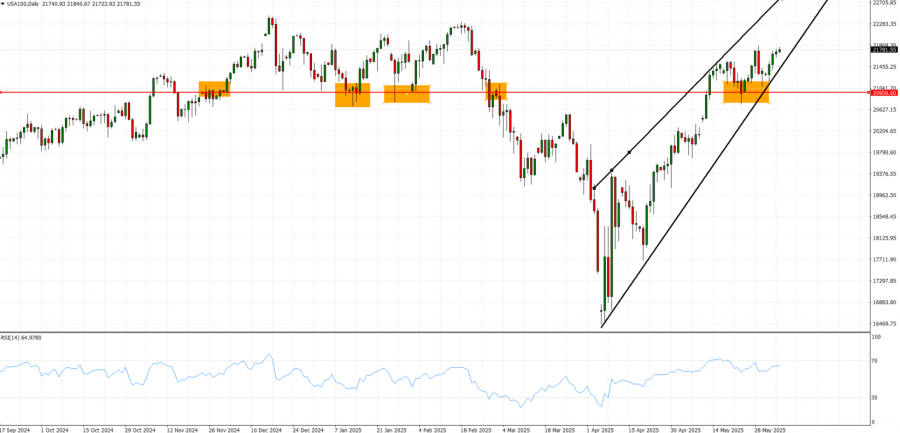
GRAPH (Daily): September 2024 – June 2025
Please note that past performance does not guarantee future results
USA100, June 5, 2025
Current Price: 21,750
|
USA100 |
Weekly |
|
Trend direction |
|
|
23,000 |
|
|
22,700 |
|
|
22,250 |
|
|
21,300 |
|
|
21,200 |
|
|
21,000 |
Example of calculation based on weekly trend direction for 1.00 Lot1
|
USA100 |
||||||
|
Profit or loss in $ |
12,500 |
9,500 |
5,000 |
-4,500 |
-5,500 |
-7,500 |
|
Profit or loss in €² |
10,943 |
8,317 |
4,377 |
-3,940 |
-4,815 |
-6,566 |
|
Profit or loss in £² |
7,926 |
6,024 |
3,171 |
-2,854 |
-3,488 |
-4,756 |
|
Profit or loss in C² |
17,069 |
12,972 |
6,828 |
-6,145 |
-7,510 |
-10,241 |
- 1.00 lot is equivalent of 10 units
- Calculations for exchange rate used as of 10:45 (GMT+1) 05/06/2025
There is a possibility to use Stop-Loss and Take-Profit.
- You may wish to consider closing your position in profit, even if it is lower than suggested one.
- Trailing stop technique could protect the profit.