USA100 Weekly Special Report based on 1.00 Lot Calculation:
USA100:
- USA100 represents the Nasdaq 100, which includes 100 of the largest and most innovative non-financial companies listed on the Nasdaq exchange. It features global tech and AI leaders such as Apple, Google, ARM, Nvidia, Meta, Microsoft, Amazon, and others. In essence, USA100 reflects the strength and evolution of the modern digital economy in the United States.
GEOPOLITICS: US TAX CUT BILL 2025
- BREAKING (JULY 4): U.S. PRESIDENT DONALD TRUMP SIGNED THE NEW TAX BILL INTO LAW. The bill includes $4.5 trillion in tax cuts aimed at boosting the U.S. economy. It is expected to serve as a significant economic stimulus. This is the largest fiscal package since the COVID-19 era and substantially larger than Trump’s 2017 tax cuts ($1.5 trillion in 2017).
- LAST TIME (DECEMBER 22, 2017): US PRESIDENT TRUMP SIGNED THE 2017 TAX CUT BILL INTO LAW. The bill was 3 times smaller than the one from 2025, worth $1.5 trillion in tax cuts.
- STATISTICS (2017 – 2018): USA100 PRICE ROSE 6.71% OVER THE FIRST ONE MONTH AFTER US PRESIDENT TRUMP SIGNED THE TAX CUT BILL INTO LAW. USA100 price rose 6.71% between the day Trump signed the bill into law (December 22, 2017) and January 22, 2018.

Data Source: Meta Trader 4 Platform
Please note that past performance does not guarantee future results
Q2 2025 EARNINGS SEASON: JULY 15 - AUGUST 15
- STATISTICS (LAST 11 QUARTERS): According to the last 11 earnings seasons, since the A.I. boom began in late 2022, USA100 rose 4.46% on average during the quarterly earnings seasons.
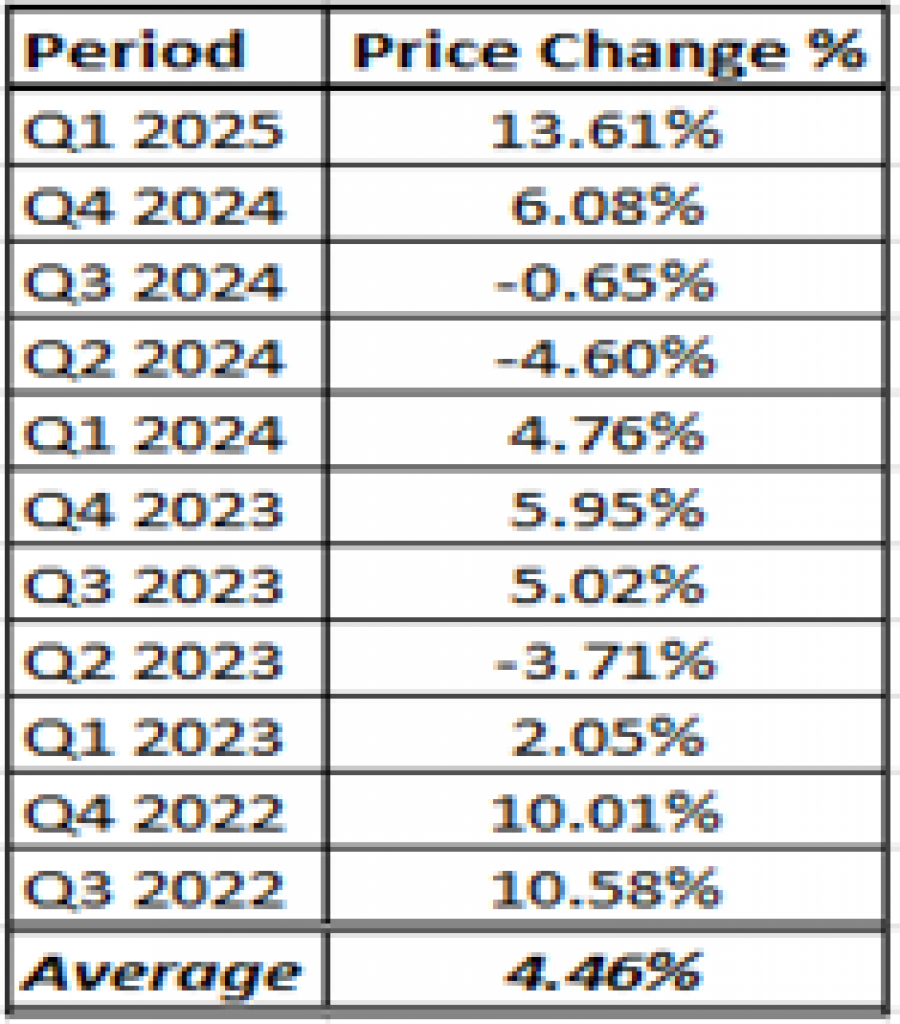
Data Source: Meta Trader 4 Platform
Please note that past performance does not guarantee future results
US Q2 EARNINGS CALENDAR: Q2 Earnings Report dates for some of the most known tech companies in the world
- NETFLIX: THURSDAY, JULY 17, AFTERMARKET
- TESLA: WEDNESDAY, JULY 23, AFTERMARKET
- FACEBOOK: WEDNESDAY, JULY 30, AFTERMARKET
- APPLE: THURSDAY, JULY 31, AFTERMARKET
- AMD: TUESDAY, AUGUST 5, AFTERMARKET
- NVIDIA: WEDNESDAY, AUGUST 27, AFTERMARKET
STATISTICS (2019 – 2024): USA100 PRICE CHANGE AFTER BREAKING ABOVE MOST RECENT ALL-TIME HIGHS
- USA100 ROSE 20.33% ON AVERAGE after breaking above the previous all-time high levels. Data considers the most recent three cases since 2019, that covers the period after 2018 trade war de-escalation, the period of recovery through the COVID-19 crisis and 2024 summer recession fears.

Data Source: Meta Trader 4 Platform
Please note that past performance does not guarantee future results
USA100, July 10, 2025
Current Price: 23,040
|
USA100 |
Weekly |
|
Trend direction |
|
|
24,500 |
|
|
24,000 |
|
|
23,400 |
|
|
22,700 |
|
|
22,500 |
|
|
22,200 |
Example of calculation based on weekly trend direction for 1.00 Lot1
|
USA100 |
||||||
|
Profit or loss in $ |
14,600 |
9,600 |
3,600 |
-3,400 |
-5,400 |
-8,400 |
|
Profit or loss in €² |
12,449 |
8,186 |
3,070 |
-2,899 |
-4,604 |
-7,162 |
|
Profit or loss in £² |
10,731 |
7,056 |
2,646 |
-2,499 |
-3,969 |
-6,174 |
|
Profit or loss in C² |
19,968 |
13,130 |
4,924 |
-4,650 |
-7,386 |
-11,489 |
- 1.00 lot is equivalent of 10 units
- Calculations for exchange rate used as of 09:45 (GMT+1) 10/07/2025
There is a possibility to use Stop-Loss and Take-Profit.
- You may wish to consider closing your position in profit, even if it is lower than suggested one.
- Trailing stop technique could protect the profit.