USA100 Weekly Special Report based on 1.00 Lot Calculation:
USA100:
- USA100 represents the Nasdaq 100, which includes 100 of the largest and most innovative non-financial companies listed on the Nasdaq exchange. It features global tech and AI leaders such as Apple, Google, ARM, Nvidia, Meta, Microsoft, Amazon, and others. In essence, USA100 reflects the strength and evolution of the modern digital economy in the United States.
Q2 2025 EARNINGS SEASON: JULY 15 - AUGUST 15
- STATISTICS (LAST 11 QUARTERS): According to the last 11 earnings seasons, since the A.I. boom began in late 2022, USA100 rose 4.46% on average during the quarterly earnings seasons.
- US Q2 EARNINGS CALENDAR: Q2 Earnings Report dates for some of the most well-known tech companies in the world.
NVIDIA: WEDNESDAY, AUGUST 27, AFTERMARKET
Data Source: Meta Trader 4 Platform and Bloomberg Terminal
Please note that past performance does not guarantee future results
EVENTS:
- TUESDAY, AUGUST 12 AT 13:30 GMT+1: US INFLATION (CPI) (JULY). A lower-than-expected reading could be positive for US stock prices, because it could point to the FED cutting interest rates sooner and more aggressively. This index measures the change in the price of goods and services from the perspective of the consumer. The data for the previous month (June) came in at 2.7%.
CENTRAL BANKS:
- WEDNESDAY, SEPTEMBER 17 AT 19:00 GMT+1: US FEDERAL RESERVE INTEREST RATE DECISION. After some weaker-than-expected employment market data in July and downward revisions to June figures, markets have increased their expectations for an interest rate cut in September, expected to be followed by another in December. The benchmark interest rate currently stands at 4.5%, and according to market expectations, it is expected to decline to 4% by the end of 2025. This could put negative pressure on the US dollar and, in turn, support the US stock price.
TECHNICAL ANALYSIS:
- DAILY MOVING AVERAGES POINT TO A POSITIVE TREND: USA100 has remained above the 50-day and 20-day moving averages. However, USA100 can also change its trend if prices fall back below the 50-day and 20-day moving averages.
- MID–TERM CHANNEL: As depicted by the daily chart below, USA100 has kept trading within the mid-term uptrend channel since April 2025, confirming its mid-term trend is up. However, there remains a risk of a potential breakout below the lower channel boundary if market conditions change.
- USA100 HIT AN ALL-TIME HIGH OF 23843.80 (JULY 31, 2025): The USA100 has risen more than 10% in 2025. The USA100 has traded around 23,550.
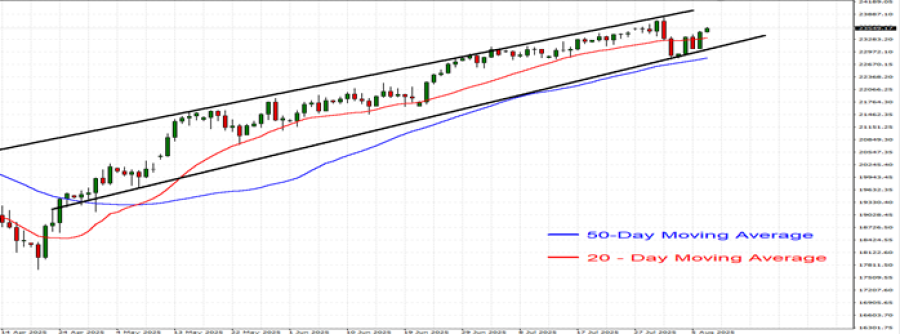
GRAPH (Daily): April 2025 – August 2025
Please note that past performance does not guarantee future results
USA100, August 7, 2025
Current Price: 23,550
|
USA100 |
Weekly |
|
Trend direction |
|
|
26,000 |
|
|
25,000 |
|
|
24,000 |
|
|
23,150 |
|
|
23,000 |
|
|
22,800 |
Example of calculation based on weekly trend direction for 1.00 Lot1
|
USA100 |
||||||
|
Pivot Points |
||||||
|
Profit or loss in $ |
24,500 |
14,500 |
4,500 |
-4,000 |
-5,500 |
-7,500 |
|
Profit or loss in €2 |
20,972 |
12,412 |
3,852 |
-3,424 |
-4,708 |
-6,420 |
|
Profit or loss in £2 |
18,325 |
10,845 |
3,366 |
-2,992 |
-4,114 |
-5,610 |
|
Profit or loss in C$2 |
33,641 |
19,910 |
6,179 |
-5,492 |
-7,552 |
-10,298 |
- 1.00 lot is equivalent of 10 units
- Calculations for exchange rate used as of 09:25 (GMT+1) 07/08/2025
There is a possibility to use Stop-Loss and Take-Profit.
- You may wish to consider closing your position in profit, even if it is lower than suggested one.
- Trailing stop technique could protect the profit.