USA100 Weekly Special Report based on 1.00 Lot Calculation:
USA100:
- USA100 represents the Nasdaq 100, which includes 100 of the largest and most innovative non-financial companies listed on the Nasdaq exchange. It features global tech and AI leaders such as Apple, Google, Tesla, Nvidia, Meta, Microsoft, Amazon, and others. In essence, USA100 reflects the strength and evolution of the modern digital economy in the United States.
EVENTS:
- FRIDAY, JANUARY 9 AT 13:30 GMT: U.S. NONFARM PAYROLLS (NFP) AND UNEMPLOYMENT RATE (DECEMBER). A softer NFP reading and a rise in the unemployment rate would reinforce expectations for Fed interest rate cuts, which typically support upside momentum in the tech-heavy USA100.
- TUESDAY, JANUARY 13 AT 13:30 GMT: US INFLATION DATA (CPI) (DECEMBER). A softer-than-expected CPI print would strengthen expectations for further Federal Reserve interest rate cuts, and potentially support higher USA100 prices.
THE “JANUARY EFFECT”:
- THE JANUARY EFFECT: The January Effect is the observed seasonal tendency for stock prices to rise in the first month of the year, often following a December sell-off for tax-loss harvesting. Investors sell underperforming stocks in December to offset capital gains and then buy them back in January. Also, at the start of the year, people get new money (like bonuses, new investments, or retirement fund contributions) and buy stocks again.
Q4 EARNING SEASON (JANUARY 12-FEBRUARY 28):
|
JANUARY 12 – FEBRUARY 28, 2026. The U.S. Q4 earnings season is expected to start in mid-January with major financial institutions, while key USA100 heavyweights such as Tesla, Netflix, Microsoft, Apple, Intel, NVIDIA, and AMD are likely to report their Q4 2025 results throughout late January and February.
-
- NETFLIX: 1/20/2026 Aftermarket, confirmed
- INTEL: 1/22/2026 Aftermarket, confirmed
- IBM: 1/28/2026 Aftermarket, confirmed
- MICROSOFT: 1/28/2026 Aftermarket, confirmed
TECHNICAL ANALYSIS:
- DAILY MOVING AVERAGES: USA100 has remained above the 20-, 50-, and 100-daily moving averages. However, USA100 can also change its trend if prices fall below the 20-, 50-, and 100-daily moving averages.
- UP-TREND SINCE NOVEMBER 2025: USA100 has remained above the orange uptrend line since November 2025, confirming the bullish trend, though a breakout below the line remains a risk if market conditions shift.
- USA100 HIT A FRESH ALL-TIME HIGH ON OCTOBER 30, 2024 (26,397.93). USA100 was last trading around 25,750, and if a full recovery to the recent all-time high takes place, it could see an upside potential of around 2.50%. However, the USA100 price could decline.
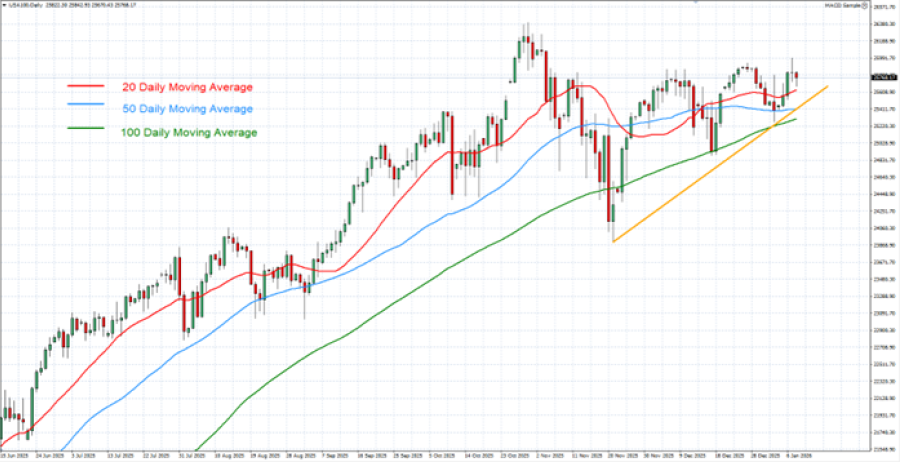
GRAPH (Daily): June 2025 – January 2026
Please note that past performance does not guarantee future results
#USA100, January 8, 2026
Current Price: 25,750
|
USA100 |
Weekly |
|
Trend direction |
|
|
27,500 |
|
|
27,000 |
|
|
26,550 |
|
|
25,150 |
|
|
25,050 |
|
|
24,950 |
Example of calculation based on weekly trend direction for 1.00 Lot1
|
USA100 |
||||||
|
Pivot Points |
||||||
|
Profit or loss in $ |
17,500 |
12,500 |
8,000 |
-6,000 |
-7,000 |
-8,000 |
|
Profit or loss in €² |
14,993 |
10,709 |
6,854 |
-5,140 |
-5,997 |
-6,854 |
|
Profit or loss in £² |
13,023 |
9,302 |
5,953 |
-4,465 |
-5,209 |
-5,953 |
|
Profit or loss in C$² |
24,297 |
17,355 |
11,107 |
-8,330 |
-9,719 |
-11,107 |
- 1.00 lot is equivalent of 10 units
- Calculations for exchange rate used as of 10:30 (GMT) 8/1/2026
There is a possibility to use Stop-Loss and Take-Profit
- You may wish to consider closing your position in profit, even if it is lower than the suggested one.
- Trailing stop technique could protect the profit