Special Report: USA500
Date: December 15, 2022
WEEKLY TREND: UP
US STOCK MARKETS
- STOCK MARKET TREND DEFINITION
BEAR MARKET: DEFINITION. According to Forbes, economists define a bear market as a decline of 20% or more of a major stock market index, such as the S&P 500, for a sustained period. SENTIMENT: During a bear market, market sentiment is poor. Investors are pessimistic about the stock market’s prospects, making them more likely to sell assets than hold them.
BULL MARKET: DEFINITION. While bear markets signal a time of pessimism and economic decline, a bull market is defined by optimism and economic growth. A bull market is a period when stock prices are rising and investor sentiment is positive. During a bull market, stocks in a broad market index increase in value by 20% or more.
Table I: Bear and Bull Market Characteristics
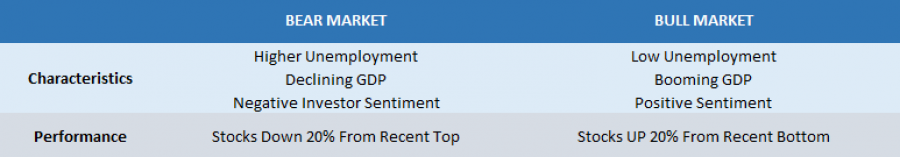
Data Source: Forbes
USA500 INDEX
- THE CASE OF THE USA500 INDEX
BEAR MARKET STARTED on May 20, 2022. The Index fell 20% from 4807.82 (January 2, 2022) to 3846.25 (May 15, 2022). The market has been there for the past 11- 12 months, having a maximum drop of 27.16% (October 13, 2022).
BEAR MARKET BOTTOM: October 13, 2022. The Index fell to 3502.08 by October 13, 2022, marking a total decline of 27.16% from its recent top of 4807.82 (January 2, 2022).
INDEX HAS RISEN 14% FROM RECENT BOTTOM (2 Months): December 15, 2022. The index currently trades around 4000. If it adds 6% more, it will then confirm the index is in a new Bull Market. However, the price could decline further.
- MOST RECENT RECOVERY FOLLOWING A BEAR MARKET (USA500):
2020 (COVID PANDEMIC DECLINE): After the pandemic decline of 34%, testing the rate of 2170.25 (March 22, 2020), the index had risen around 121.5% to its most recent all time high of 4807.82 (January 2, 2022).
2007- 2008 (GLOBAL FINANCIAL CRISIS): After a decline of around 57%, testing the rate of 665.75 (March 1, 2009), the index trended up in a strong bull run to add around 410% until the Covid Pandemic Crisis (February 16, 2020 to reach the level of 3397.08).
However, please note that past performance does not guarantee future results.
STOCK MARKET TRENDS
- THE SANTA CLAUSE RALLY: THE STOCK MARKET INCREASE AT YEAR-END (End of December)
According to CNBC, U.S. stocks often rise at year-end, delivering higher returns for investors. The trend, known as the “Santa Claus rally,” encompasses the last five trading days of the calendar year and the first two of the new year. The S&P 500 was positive during those seven days in 15 of the 20 years (or 75% of the time).
- THE JANUARY EFFECT:
According to Investopedia, The January Effect is a market anomaly whereby stock prices may tend to rise in the first month of the year.
However, please note that past performance does not guarantee future results.
Current Price:3980
|
USA500 |
Weekly |
|
Trend direction |
|
|
4630 |
|
|
4400 |
|
|
4200 |
|
|
3800 |
|
|
3750 |
|
|
3700 |
Example of calculation based on weekly trend direction for 1 Lot1
|
USA500 |
||||||
|
Pivot Points |
||||||
|
Profit or loss in $ |
6,500 |
4,200 |
2,200 |
-1,800 |
-2,300 |
-2,800 |
|
Profit or loss in €2 |
6,126 |
3,958 |
2,073 |
-1,696 |
-2,168 |
-2,639 |
|
Profit or loss in £2 |
5,285 |
3,415 |
1,789 |
-1,463 |
-1,870 |
-2,276 |
|
Profit or loss in C$2 |
8,827 |
5,703 |
2,988 |
-2,444 |
-3,123 |
-3,802 |
1. 1.00 lot is equivalent of 10 units
2. Calculations for exchange rate used as of 09:35 (GMT) 15/12/2022
Fortrade recommends the use of Stop-Loss and Take-Profit, please speak to your Senior Account ManagerClient Manager regarding their use.
- You may wish to consider closing your position in profit, even if it is lower than suggested one
- Trailing stop technique can protect the profit – Ask your Senior Account ManagerClient Manager for more detail