USA500 Weekly Special Report based on 1.00 Lot Calculation:
USA500:
- USA500 represents the S&P 500, which includes 500 of the largest publicly traded companies in the United States across all major sectors. It features industry leaders such as Tesla, Apple, Google, Nvidia, Meta, and Goldman Sachs.
Q2 2025 EARNINGS SEASON: JULY 15 - AUGUST 15
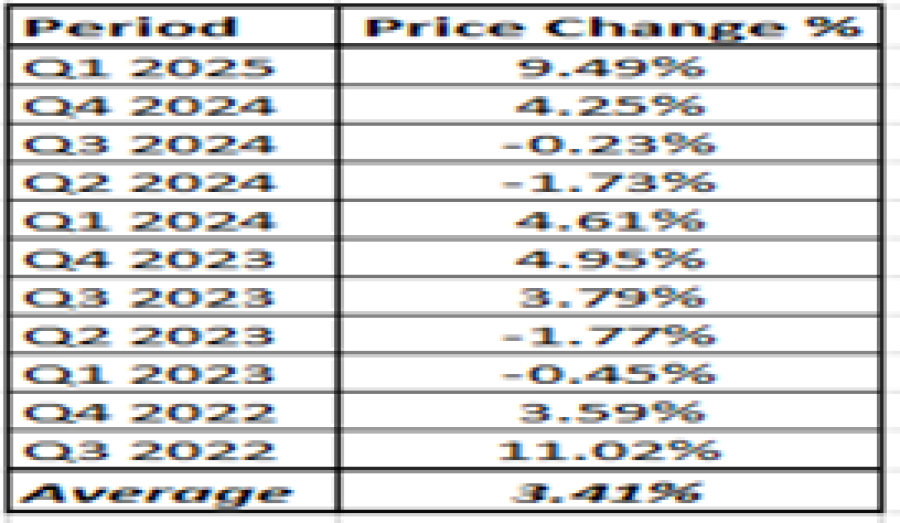
- STATISTICS (LAST 11 QUARTERS): According to the last 11 earnings seasons, since the A.I. boom began in late 2022, USA500 rose 3.41% on average during the quarterly earnings seasons.
Data Source: MetaTrader 4 Platform
Please note that past performance does not guarantee future results
US Q2 EARNINGS CALENDAR: Q2 Earnings Report dates for some of the most well-known tech companies in the world
- BOEING: TUESDAY, JULY 29, PREMARKET
- PAYPAL: TUESDAY, JULY 29, PREMARKET
- FACEBOOK: WEDNESDAY, JULY 30, AFTERMARKET
- MICROSOFT: WEDNESDAY, JULY 30, AFTERMARKET
- APPLE: THURSDAY, JULY 31, AFTERMARKET
- AMAZON: THURSDAY, JULY 31, AFTERMARKET
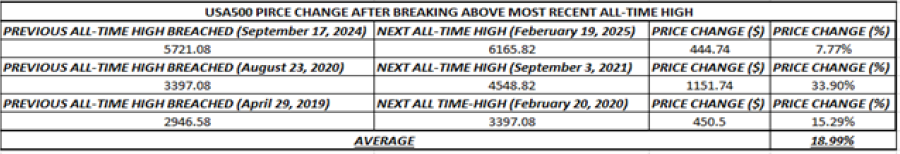
STATISTICS (2019 – 2024): USA500 PRICE CHANGE AFTER BREAKING ABOVE MOST RECENT ALL-TIME HIGHS
- USA500 ROSE 18.99% ON AVERAGE after breaking above the previous all-time high levels. Data considers the most recent three cases since 2019, which covers the period after the 2018 trade war de-escalation, the period of recovery through the COVID-19 crisis, and the 2024 summer recession fears.
Data Source: MetaTrader 4 Platform
Please note that past performance does not guarantee future results
TECHNICAL ANALYSIS:
- WEEKLY MOVING AVERAGES POINT TO AN UPTREND: USA500 has remained above the 20 - and 50-day moving averages, pointing to an ongoing uptrend. However, USA500 can also change its trend if prices fall below the 20 - and 50-day moving averages.
- MID–TERM UPTREND CHANNEL: As depicted by the daily chart below, USA500 has kept trading within the mid-term black-lined uptrend channel, confirming its mid-term trend is up. However, there remains a risk of a potential breakout below the lower channel boundary if market conditions change.
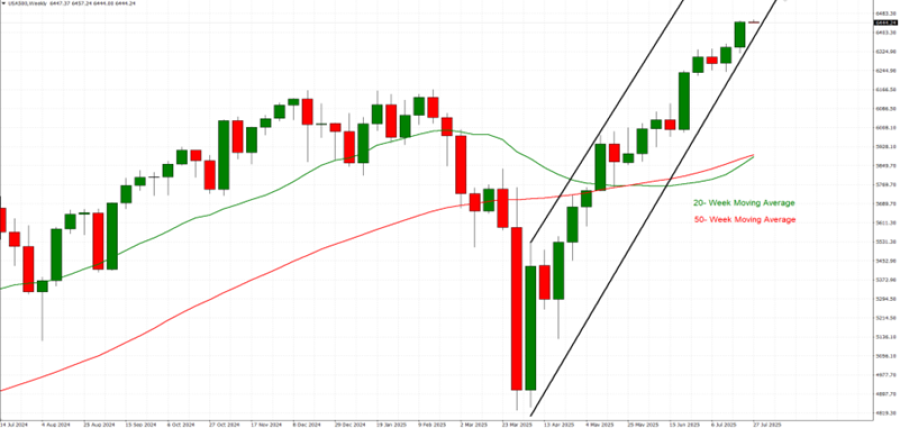
GRAPH (Weekly): July 2024 – July 2025
Please note that past performance does not guarantee future results
USA500, July 28, 2025
Current Price: 6,440
|
USA500 |
Weekly |
|
Trend direction |
|
|
6,800 |
|
|
6,700 |
|
|
6,550 |
|
|
6,340 |
|
|
6,300 |
|
|
6,250 |
Example of calculation based on weekly trend direction for 1.00 Lot1
|
USA500 |
||||||
|
Pivot Points |
||||||
|
Profit or loss in $ |
3,600 |
2,600 |
1,100 |
-1,000 |
-1,400 |
-1,900 |
|
Profit or loss in €² |
3,083 |
2,226 |
942 |
-856 |
-1,199 |
-1,627 |
|
Profit or loss in £² |
2,683 |
1,937 |
820 |
-745 |
-1,043 |
-1,416 |
|
Profit or loss in C$² |
4,943 |
3,570 |
1,510 |
-1,373 |
-1,922 |
-2,609 |
- 1.00 lot is equivalent of 10 units
- Calculations for exchange rate used as of 10:15 (GMT+1) 28/07/2025
There is a possibility to use Stop-Loss and Take-Profit.
- You may wish to consider closing your position in profit, even if it is lower than suggested one.
- Trailing stop technique could protect the profit.