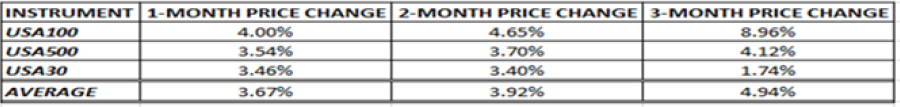
USA500 Weekly Special Report based on 1.00 Lot Calculation:
USA500:
- USA500 represents the S&P 500, which includes 500 of the largest publicly traded companies in the United States across all major sectors. It features industry leaders such as Tesla, Apple, Google, Nvidia, Meta, and Goldman Sachs.
US FEDERAL RESERVE:
- BREAKING (SEPTEMBER 17): US FEDERAL RESERVE CUT INTEREST RATE TO 4.25% FROM 4.50%, ITS FIRST INTEREST RATE CUT SINCE DECEMBER 2024. The Federal Reserve policymakers said they expect to see 2 more rate cuts by the end of 2025, to slash current rates to 3.75%.
- NEXT FEDERAL RESERVE MEETING AND INTEREST RATE DECISION: October 29.
- STATISTICS: LAST TIME WHEN AN INTEREST RATE CUT CYCLE BEGAN (SEPTEMBER 18, 2024, AND AFTER): The U.S. Federal Reserve began its previous rate-cut cycle on September 18, 2024, lowering rates from 5.50% to 5.00%.
Date Source: Meta Trader 4
Please note that past performance does not guarantee future results
COMPANY EVENTS (SEPTEMBER- OCTOBER 2025):
- TESLA: Q3 CAR DELIVERY DATA (EXPECTED: OCTOBER 2, PREMARKET): Tesla is projected to deliver over 480,000 vehicles in Q3 2025, up 25% from Q2 (384,122) and 3.7% year-on-year (462,890).
- BOEING: CHINA EXPECTED TO ORDER 500 NEW BOEING AIRCRAFTS. As part of the broader USA-China trade talks, Boeing was said to have engaged in talks with China to receive orders equal to 500 aircraft.
- NVIDIA: NVIDIA GTC A.I. EVENT (WASHINGTON, D.C., USA) (OCTOBER 27 – 29). Nvidia has recently posted record quarterly earnings results for the second quarter, and the upcoming A.I. event should improve investors’ confidence towards innovation and new technology that could increase NVIDIA's sales and profits.
- US Q3 EARNINGS SEASON BEGINS IN OCTOBER: The Q3 company earnings season is expected to begin with the banking sector during the second week of October 2025.
EVENTS:
- FRIDAY, OCTOBER 3 AT 13:30 GMT+1: US NONFARM PAYROLLS (NFP) AND UNEMPLOYMENT RATE (SEPTEMBER). The US labor market data remains one of the most important indicators used by the US Fed, which could potentially predict whether and when new interest rate cuts may be implemented. The US unemployment rate remained above 4%, coming in at 4.3% for August.
TECHNICAL ANALYSIS:
- UPTREND CHANNEL SINCE APRIL 2025: According to the daily chart below, USA500 has been rising within a well-defined uptrend channel (black parallel lines), that has been in place since early April. Since April’s bottom, USA500 prices have gone up around 40%.
- DAILY MOVING AVERAGE POINT TO UPTREND AS WELL: The chart below also shows that USA500 currently trades above all major 20-, 50- and 100- Day Moving Averages, confirming the positive trend. Prices, however, could fall if USA500 breaks below the 20-, 50- and 100- Day Moving Averages.
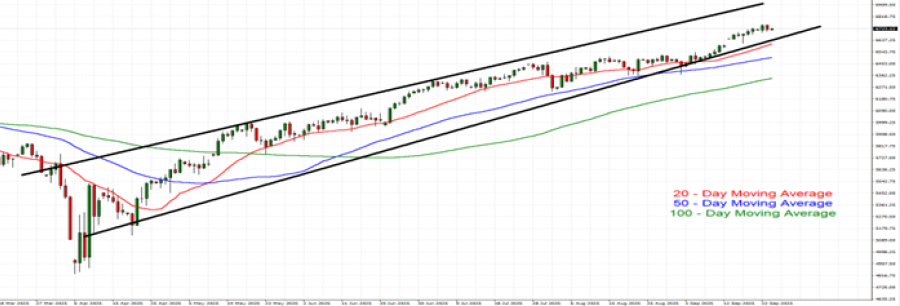
GRAPH (Daily): March 2025– September 2025
Please note that past performance does not guarantee future results.
#USA500, September 24, 2025.
Current Price: 6,720
|
USA500 |
Weekly |
|
Trend direction |
|
|
7,100 |
|
|
7,000 |
|
|
6,850 |
|
|
6,600 |
|
|
6,550 |
|
|
6,500 |
Example of calculation based on weekly trend direction for 1.00 Lot1
|
USA500 |
||||||
|
Pivot Points |
||||||
|
Profit or loss in $ |
3,800 |
2,800 |
1,300 |
-1,200 |
-1,700 |
-2,200 |
|
Profit or loss in €² |
3,232 |
2,382 |
1,106 |
-1,021 |
-1,446 |
-1,871 |
|
Profit or loss in £² |
2,821 |
2,079 |
965 |
-891 |
-1,262 |
-1,633 |
|
Profit or loss in C$² |
5,271 |
3,884 |
1,803 |
-1,665 |
-2,358 |
-3,052 |
- 1.00 lot is equivalent of 10 units
- Calculations for exchange rate used as of 11:00 (GMT+1) 24/09/2025
There is a possibility to use Stop-Loss and Take-Profit
- You may wish to consider closing your position in profit, even if it is lower than the suggested one.
- Trailing stop technique could protect the profit