USA500 Weekly Special Report based on 1.00 Lot Calculation:
USA500:
- USA500 represents the S&P 500, which includes 500 of the largest publicly traded companies in the United States across all major sectors. It features industry leaders such as Tesla, Apple, Google, Nvidia, Meta, and Goldman Sachs.
- GLOBAL BENCHMARK INDEX: The S&P 500 is the most widely followed equity index in the world and a key benchmark for global investors. It serves as a barometer of the U.S. economy and broader market sentiment. According to Investopedia, since 1957, the S&P 500 has delivered an average annual return of 10.56%.
EVENTS:
- FRIDAY, FEBRUARY 27 AT 13:30 GMT: U.S. PRODUCER PRICE INDEX (PPI) (JANUARY). PPI measures wholesale inflation and provides early signals on cost pressures for businesses. A softer than expected reading would continue easing inflation concerns and support expectations of Fed rate cuts, likely supporting the S&P 500.
- MONDAY, MARCH 2 AT 13:30 GMT: U.S. ISM MANUFACTURING PMI (FEBRUARY). The ISM PMI reflects overall activity in the manufacturing sector. A stronger reading would indicate solid economic momentum, supporting corporate earnings and the USA500. The previous month’s data stood at 52.6.
Q4 2025 EARNINGS SEASON (FEBRUARY 24 - FEBRUARY 28)
- FEBRUARY 24 – FEBRUARY 28, 2026. The U.S. Q4 earnings season began in January, with major financial institutions already reporting. Key USA500 heavyweights such as Tesla, Meta, Apple, Intel, Walmart and AMD have now posted their Q4 2025 results. The next major companies to report are NVIDIA and Berkshire Hathaway.
- HP Inc: 2/25/2026, Aftermarket
- NVIDIA: 2/25/2026, Aftermarket
- Berkshire Hathaway Inc: 2/28/2026, Premarket
Data Source: Bloomberg Terminal.
NVIDIA: THE LARGEST STOCK COMPONENT OF THE USA500
- NVIDIA MAKES UP TO 8% OF THE USA500: NVIDIA is the world’s largest company by market capitalization and the most heavily weighted stock in the USA500. According to some reports it takes up 8%.
- EVENT (WEDNESDAY, FEBRUARY 25, AFTERMARKET): Q4 EARNINGS REPORT. According to Bloomberg, Nvidia is expected to report record Q4 2025 revenue of $65.8 billion, up about 67% year over year. Quarterly earnings are also projected to reach a record $37.42 billion, marking an increase of roughly 69% compared with the same period last year.
TECHNICAL ANALYSIS:
- UPTREND SINCE MAY 2025: USA500 has remained above the black uptrend line since May 2025, that has acted as a support confirming the bullish trend. It has also remained above 150-daily moving average confirming mid-term uptrend. However, USA500 can also change its trend if prices break below these levels.
- PRICE ACTION: USA500 HIT A FRESH ALL-TIME HIGH ON JANUARY 28, 2026 (7,042.50). USA500 currently trades around 6,914 and if a full recovery takes place, then USA500 prices could see an upside of 1.8%. The USA500 price rose 16% in 2025, extending its positive trend from 2024 (+23.20%) and 2023 (+24.65%). However, the price can also change its trend.
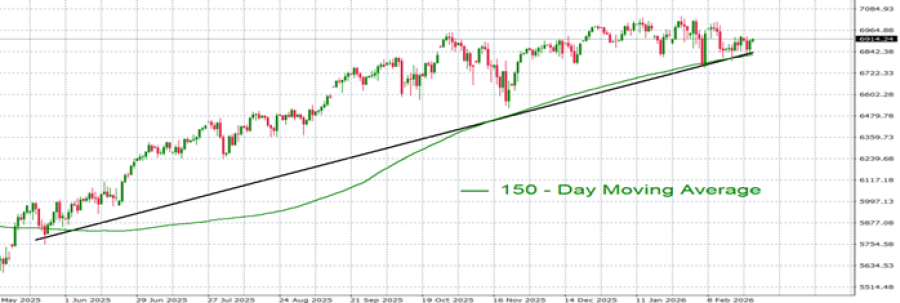
GRAPH (Daily): May 2025 – February 2026
Please note that past performance does not guarantee future results
#USA500, February 25, 2026
Current Price: 6,914
|
USA500 |
Weekly |
|
Trend direction |
|
|
7,500 |
|
|
7,300 |
|
|
7,100 |
|
|
6,750 |
|
|
6,700 |
|
|
6,650 |
Example of calculation base on weekly trend direction for 1.00 Lot1
|
USA500 |
||||||
|
Pivot Points |
||||||
|
Profit or loss in $ |
5,860 |
3,860 |
1,860 |
-1,640 |
-2,140 |
-2,640 |
|
Profit or loss in €2 |
4,972 |
3,275 |
1,578 |
-1,391 |
-1,816 |
-2,240 |
|
Profit or loss in £2 |
4,336 |
2,856 |
1,376 |
-1,213 |
-1,583 |
-1,953 |
|
Profit or loss in C$2 |
8,026 |
5,287 |
2,548 |
-2,246 |
-2,931 |
-3,616 |
- 1.00 lot is equivalent of 10 units
- Calculations for exchange rate used as of 09:40 (GMT) 25/02/2026
There is a possibility to use Stop-Loss and Take-Profit.
- You may wish to consider closing your position in profit, even if it is lower than suggested one.
- Trailing stop technique could protect the profit.