Copper Weekly Special Report based on 1 Lot Calculation:
COPPER USE AND MARKET SHARE:
- TOP COPPER PRODUCERS: Chile (27% of the world total), China (8%), Peru (8%), the Democratic Republic of Congo (6%), Australia (5%), Mexico (5%), Indonesia (4%), Russia (3%), and Canada (2%).
- TOP COPPER CONSUMERS: China (52% of the world’s total), the United States (7%), the European Union (8%), and Japan (4%).
- TOP COPPER INDUSTRIES: Copper is heavily demanded in the EV industry, renewable energy industry (wind & solar farms), electrical infrastructure, telecommunications, and construction. The EV and green industries show the biggest growth rates (10-15% and 5%, respectively).
COPPER MARKET: TIGHT SUPPLY AND RISING DEMAND SUPPORT 2026 OUTLOOK
- MARKET BALANCE: COPPER MARKET EXPECTED TO BE IN DEFICIT IN 2026. Ongoing mine disruptions around the world and declining ore grades continue to restrict supply growth, while demand remains supported by electrification and A.I. infrastructure needs.
- INDUSTRIAL DEMAND: ELECTRIFICATION, MILITARY, AND A.I. INFRASTRUCTURE INVESTMENT INCREASES DEMAND. Copper demand remains structurally strong, supported by power grid expansion, renewable energy projects, A.I. Data centers construction, electric vehicles, rising industrial activity, and increased military spending, all reinforcing the demand outlook into 2026.
EVENTS (CHINA):
- WEDNESDAY, MARCH 4 AT 01:30 GMT: CHINA MANUFACTURING PMI (FEBRUARY). A stronger-than-expected PMI reading would signal improving factory activity in China, supporting industrial output and infrastructure demand, which would be positive for copper prices.
- MONDAY, MARCH 9 AT 01:30 GMT: CHINA INFLATION DATA (CPI) (FEBRUARY). A stronger CPI reading would point to improving domestic demand in China, supporting manufacturing and construction activity, both key drivers of copper consumption.
- TUESDAY, MARCH 10 AT 03:00 GMT: CHINA EXPORTS AND IMPORTS DATA (FEBRUARY). Stronger-than-expected import and exports figures would signal improving industrial demand in China, the world’s largest copper consumer, supporting manufacturing activity and reinforcing a positive outlook for copper prices.
EVENTS (USA):
- MONDAY, MARCH 2 AT 14:45 GMT: USA MANUFACTURING PMI (FEBRUARY). A stronger-than-expected PMI reading would signal improving factory activity in the U.S., supporting industrial metals demand and reinforcing a constructive outlook for copper prices.
- FRIDAY, MARCH 6 AT 13:30 GMT: USA NON-FARM PAYROLLS (NFP) & UNEMPLOYMENT RATE (FEBRUARY). Weaker-than-expected job growth and a higher unemployment rate could increase expectations of Fed rate cuts, potentially weighing on the U.S. dollar and supporting copper prices.
TECHNICAL ANALYSIS:
- UPTREND AND RECOVERY SINCE EARLY AUGUST 2025: Copper prices have traded within an uptrend channel since early August, as depicted by the daily chart below. However, there remains a risk of a potential breakout below this level if market conditions change.
- DAILY MOVING AVERAGES POINT TO UPTREND: Copper prices have recently traded above the 20-, 50-, and 100-Daily Moving Averages, pointing to an ongoing uptrend. However, Copper prices can also change their trend if prices fall below the 20-, 50-, and 100-Daily Moving Averages.
- SUPPORT AREA: $5.600 – $5.500. This zone represents its next support area for Copper prices.
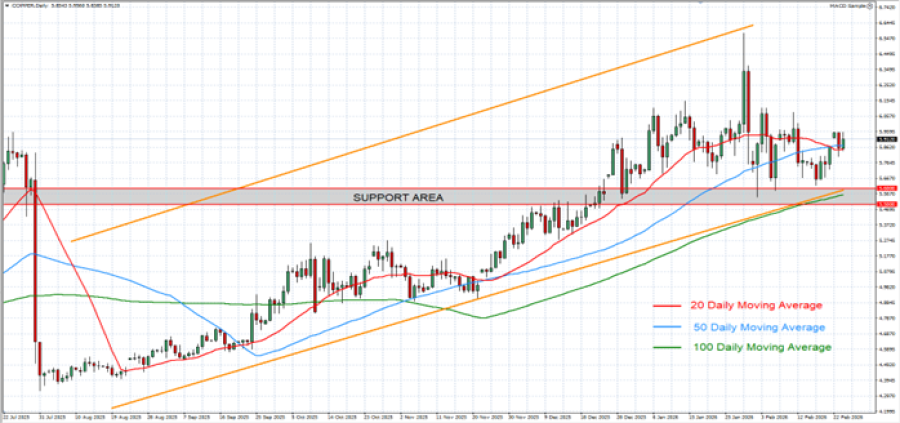
GRAPH (Daily): July 2025 - February 2026
Please note that past performance does not guarantee future results
COPPER, February 24, 2026
Current Price: 5.900
|
COPPER |
Weekly |
|
Trend direction |
|
|
6.600 |
|
|
6.400 |
|
|
6.300 |
|
|
5.600 |
|
|
5.550 |
|
|
5.500 |
Example of calculation based on weekly trend direction for 1.00 Lot1
|
COPPER |
||||||
|
Pivot Points |
||||||
|
Profit or loss in $ |
7,000 |
5,000 |
4,000 |
-3,000 |
-3,500 |
-4,000 |
|
Profit or loss in €² |
5,938 |
4,242 |
3,393 |
-2,545 |
-2,969 |
-3,393 |
|
Profit or loss in £² |
5,185 |
3,704 |
2,963 |
-2,222 |
-2,593 |
-2,963 |
|
Profit or loss in C$² |
9,590 |
6,850 |
5,480 |
-4,110 |
-4,795 |
-5,480 |
- 1.00 lot is equivalent of 10 000 units
- Calculations for exchange rate used as of 9:45 (GMT) 24/2/2026
There is a possibility to use Stop-Loss and Take-Profit
- You may wish to consider closing your position in profit, even if it is lower than the suggested one.
- Trailing stop technique could protect the profit