USD/CAD weekly special report based on 1 Lot Calculation:
- EVENT (FRIDAY, JUNE 7 AT 13:30 GMT+1): US NONFARM PAYROLL (NFP) AND UNEMPLOYMENT RATE (MAY). The US Unemployment rate sdands at 3.9% currently, up from previous 3.8%. This trend is expected to support expectations for the US Fed to start soon it next rate cut cycle, which could be negative for the US dollar.
- EVENT (FRIDAY, JUNE 7 AT 13:30 GMT+1): CANADA EMPLOYMENT CHANGE AND UNEMPLOYMENT RATE (MAY). The Canadian unemployment rate stands currently at 6.1%, but down from previous 6.2%. If the trend continues on, the Bank of Canada may consider to pause the process of cutting its rates, which could be positive for the Canadian dollar.
- EVENT (WEDNESDAY, JUNE 12 AT 13:30 GMT+1): US INFLATION (CPI) (MAY). The US Inflation stands currently at 3.4%, down from previous 3.5%, which could also encourage the Fed to consider cutting its rates in the coming period. This could be negative for the US dollar.
- EVENT (WEDNESDAY, JUNE 12 AT 19:00 GMT+1): US FEDERAL RESERVE INTEREST RATE DECISION. The US Fed is expected to keep interest rates unchanged at 5.50% on Wednesday, but they are still expected to cut rates at least twice by 0.25% points by the end of 2024. If confirmed by the Fed, the US dollar could come under negative pressure.
- EVENT (TUESDAY, JUNE 25 AT 13:30 GMT+1): CANADA INFLATION (CPI) (MAY). The Canadian Inflation stands currenly at 2.7%, down from previous 2.9%. The Canadian inflation is still above the central bank’s target of 2.00%, which could discourage the Bank of Canada to keep cutting its benchmark interest rate. This could be positive for the Canadian Dollar.
- TECHNICAL ANALYSIS: THE USD/CAD IS TRADING NEAR THE TOP OF ITS SIDEWAYS CHANNEL (BETWEEN 1.3200 AND 1.3850). The chanel has been in place since mid- 2022, whereby the USD/CAD has tested the upper boundary of 1.38500 four times. On the downside, the USD/CAD has tested the lower boundery three times over the same period. The USD/CAD could be expected to soon undergo a downward correction after recently testing its upper boundary of 1.38500.
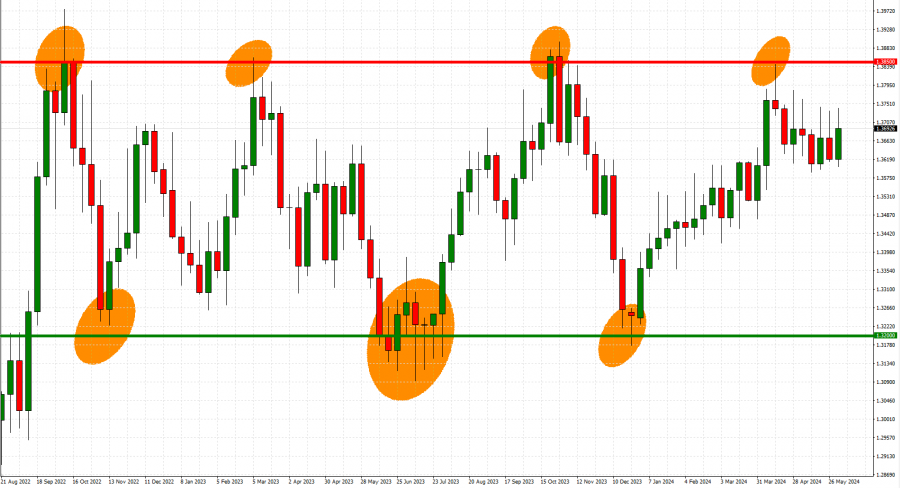
GRAPH: Weekly (July 2022 – June 2024)
USD/CAD, June 6, 2024
Current Price: 1.3695
|
USD/CAD |
Weekly |
|
Trend direction |
|
|
1.3830 |
|
|
1.3800 |
|
|
1.3750 |
|
|
1.3630 |
|
|
1.3500 |
|
|
1.3400 |
Example of calculation based on weekly trend direction for 1 Lot1
|
USD/CAD |
||||||
|
Pivot Points |
||||||
|
Profit or loss in $ |
-986 |
-767 |
-402 |
475 |
1,424 |
2,155 |
|
Profit or loss in €2 |
-907 |
-705 |
-369 |
437 |
1,310 |
1,981 |
|
Profit or loss in £2 |
-771 |
-600 |
-314 |
371 |
1,114 |
1,686 |
|
Profit or loss in C$2 |
-1,350 |
-1,050 |
-550 |
650 |
1,950 |
2,950 |
1. 1.00 lot is equivalent of 100,000 units
2. Calculations for exchange rate used as of 10:30 (GMT+1) 06/06/2024
Fortrade recommends the use of Stop-Loss and Take-Profit, please speak to your Senior Account ManagerClient Manager regarding their use.
- You may wish to consider closing your position in profit, even if it is lower than suggested one
- Trailing stop technique can protect the profit – Ask your Senior Account ManagerClient Manager for more detail