USD/JPY Weekly Special Report based on 1.00 Lot Calculation:
GEOPOLITICS: US GOVERNMENT SHUTDOWN BEGAN
- BREAKING (WEDNESDAY, OCTOBER 1 AT 05:00 AM GMT+1): US GOVERNMENT SHUTDOWN BEGAN. According to Reuters, U.S. President Donald Trump and his Democratic opponents made no progress at a White House meeting aimed at heading off a government shutdown U.S. Without passage of funding legislation, parts of the government would close on Wednesday (October 1). The ongoing worries are expected to put negative pressure on the US dollar.
EVENTS:
- WEDNESDAY, OCTOBER 1 AT 13:15 GMT+1: US ADP NONFARM EMPLOYMENT CHANGE (SEPTEMBER). Data in August came in at 53,000, below the forecasted 73,000. Moreover, that was a decline from July’s 106,000. If data for September show another weak figure, it could then accelerate the rate cut cycle by the Fed.
- WEDNESDAY, OCTOBER 1 AT 15:00 GMT+1: US ISM MANUFACTURING PMI (SEPTEMBER). Investors will be willing to see which way the manufacturing activity is going in the USA as the Fed cut rates in September. Data for August came in at 49.1, and levels below that in September could accelerate the rate cut cycle by the Fed.
- FRIDAY, OCTOBER 3 AT 13:30 GMT+1: US NONFARM PAYROLLS (NFP) AND UNEMPLOYMENT RATE (SEPTEMBER) (CONDITIONAL ON IF U.S. GOVERNMENT REMAINS SHUT DOWN). The US labor market data remains one of the most important indicators used by the US Fed, which could potentially signal when new interest rate cuts could be implemented. The unemployment rate held above 4% in August, at 4.3%. Another weak reading could increase pressure on the U.S. dollar.
CENTRAL BANKS' INTEREST RATE DECISIONS: US FEDERAL RESERVE & BANK OF JAPAN
- WEDNESDAY, OCTOBER 29 AT 19:00 GMT+1: US FEDERAL RESERVE INTEREST RATE CUT DECISION. The benchmark interest rate currently stands at 4.25%, and according to market expectations, it is expected to be cut to 4.00% on October 29, 2025. The Federal Reserve faces growing pressure to ease policy as the U.S. labor market shows clear signs of weakness. This could put negative pressure on the US dollar.
- THURSDAY, OCTOBER 30 AT 04:00 GMT+1: BANK OF JAPAN INTEREST RATE DECISION. The Bank of Japan’s base rate currently stands at 0.50%. The markets still anticipate rate hikes to take place at the coming meetings, including at the one on October 30.
TECHNICAL ANALYSIS:
- STRONG PSYCHOLOGICAL RESISTANCE: 150. The daily chart below shows that the USD/JPY has spent most of its time in 2025 below the mark of 150, which has been playing a strong resistance throughout the period.
- DAILY MOVING AVERAGES POINT TO DOWNTREND: USDJPY has recently traded below the 20- and 50-Day Moving Averages, pointing to an ongoing downtrend. However, USDJPY can also change its trend if prices rise above the 20- and 50-Day Moving Averages.
- 14- DAY RELATIVE STRENGTH INDEX (RSI) STAYS BELOW 50: The chart below shows that the 14-day relative strength index (RSI) remains in a downtrend, floating below the break-even point of 50, towards the limit of 30.
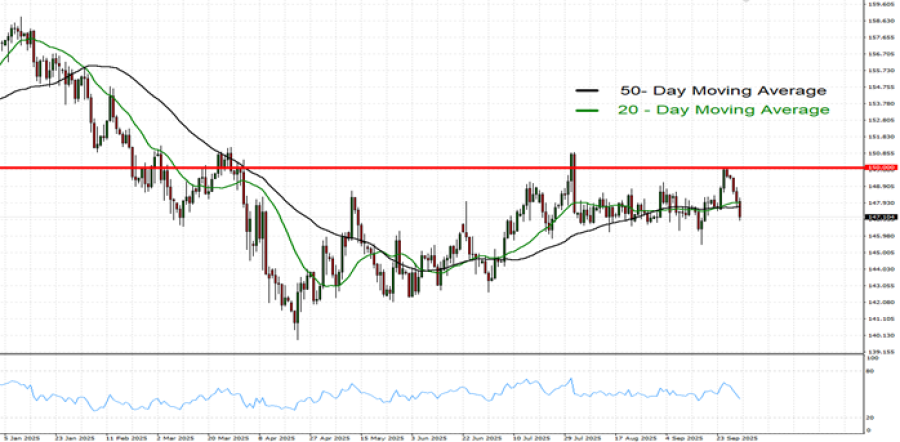
GRAPH (Daily): January 2025 – September 2025
Please note that past performance does not guarantee future results
USD/JPY, October 1, 2025.
Current Price: 147.30
|
USD/JPY |
Weekly |
|
Trend direction |
|
|
150.00 |
|
|
149.50 |
|
|
149.00 |
|
|
145.50 |
|
|
144.00 |
|
|
142.00 |
Example of calculation base on weekly trend direction for 1.00 Lot1
|
USD/JPY |
||||||
|
Pivot Points |
||||||
|
Profit or loss in $ |
-1,835 |
-1,495 |
-1,155 |
1,223 |
2,243 |
3,602 |
|
Profit or loss in €2 |
-1,563 |
-1,273 |
-984 |
1,042 |
1,910 |
3,067 |
|
Profit or loss in £2 |
-1,363 |
-1,110 |
-858 |
908 |
1,666 |
2,675 |
|
Profit or loss in C$2 |
-2,554 |
-2,081 |
-1,608 |
1,703 |
3,122 |
5,014 |
- 1.00 lot is equivalent of 100,000 units
- Calculations for exchange rate used as of 09:00 (GMT+1) 01/10/2025
There is a possibility to use Stop-Loss and Take-Profit.
- You may wish to consider closing your position in profit, even if it is lower than suggested one.
- Trailing stop technique could protect the profit.