Wheat Weekly Special Report based on 1.00 Lot Calculation:
GLOBAL WHEAT MARKET SHARE:
- LARGEST WHEAT PRODUCERS (OF TOTAL PRODUCTION EXPECTED IN 2024/2025: 793.24 MILLION TONES): China at 17%, the European Union at ~17%, India at ~14%, Russia at ~12%, USA at ~6%, and Ukraine at ~3%.
- LARGEST WHEAT EXPORTERS OF A TOTAL 212.31 MILLION TONS (2024/2025): Russia at 22.62%, the European Union at 14.13%, Canada at 12.25%, Australia at 11.78%, the USA at 10.58%, and Ukraine at 7.54%.
- RUSSIA + UKRAINE SHARE at ~30%: Russia and Ukraine account for nearly one-third of total global exports.
IMPACT OF THE ISRAEL-IRAN CONFLICT:
The Israel-Iran conflict has introduced new risks to the global wheat market, mainly through its indirect impact on energy and agricultural input costs. Key effects include:
- FERTILIZER SUPPLY RISKS: Approximately 40% of global urea exports are at risk due to disruptions in Iran, a major global producer of nitrogen-based fertilizers essential for improving wheat production and grain quality.
- SHIPPING DISRUPTIONS: The Strait of Hormuz (a key shipping route for global fertilizer and energy trade) is exposed to geopolitical tensions, raising concerns over potential delays and higher transport costs.
- ENERGY PRICE TRANSMISSION: Grain markets tend to follow energy markets. Rising oil prices stemming from the conflict could increase input and logistics costs for wheat producers, potentially pushing global wheat prices higher. In addition, the daily rate to charter oil tankers from the Gulf to China surged over 130% in one week, reflecting mounting risks in one of the world’s most critical trade routes.
RECENT NEWS:
- THE U.S. MAY JOIN ISRAEL IN MILITARY ACTION AGAINST IRAN. The Fordow nuclear facility is reportedly the main target. Trump has approved the operation but is delaying the final order in hopes of a diplomatic breakthrough.
- U.S. DEPLOYS DOZENS OF WARPLANES TO THE MIDDLE EAST. 32 air tankers have landed, and up to 23 more are on route. F-22 and F-35 fighter jets have been deployed, marking one of the largest U.S. military buildups in the region in recent years.
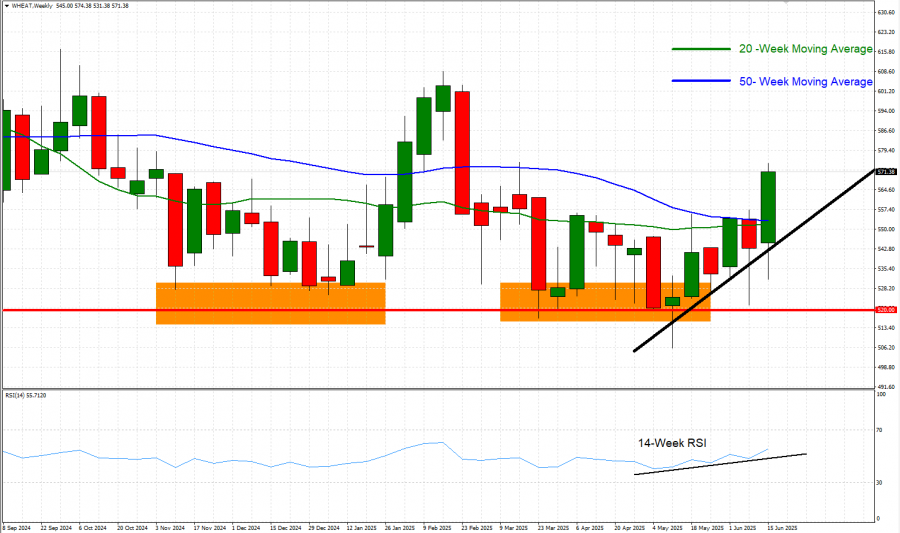
TECHNICAL ANALYSIS:
- CURRENT UPTREND: Wheat has been moving upwardly, above the uptrend black line, since early May 2025.
- SUPPORT: $520. According to the weekly chart below, Wheat has maintained support at $520, which has been the case since at least November 2024.
- WEEKLY MOVING AVERAGES POINT TO UPTREND: Wheat prices have recently traded above the 20- and 50- Week Moving Averages, pointing to an ongoing uptrend. However, Wheat prices can also change their trend if prices fall below the 20- and 50-Week Moving Averages.
- 14- WEEK RELATIVE STRENGTH INDEX (RSI) POINTS TO UPTREND: The index has been upward-sloping since May this year, and it currently trades above the neutral point of 50, indicating an uptrend. Although, this could change should the index drops back below the neutral point of 50.
- WHEAT PRICES HIT AN ALL-TIME HIGH OF $1356.50 (MARCH 2022). Wheat was trading last near $568, and if a full recovery to 2022’s all-time high occurs, this could provide an upside of around 139%. Although prices could fall, too.
GRAPH (Weekly): September 2024 – June 2025
Please note that past performance does not guarantee future results.
WHEAT, June 20, 2025
Current Price: 568
|
Wheat |
Weekly |
|
Trend direction |
|
|
630 |
|
|
610 |
|
|
590 |
|
|
550 |
|
|
540 |
|
|
525 |
Example of calculation based on weekly trend direction for 1.00 Lot1
|
WHEAT |
||||||
|
Pivot Points |
||||||
|
Profit or loss in $ |
6,200 |
4,200 |
2,200 |
-1,800 |
-2,800 |
-4,300 |
|
Profit or loss in €2 |
5,385 |
3,648 |
1,911 |
-1,563 |
-2,432 |
-3,735 |
|
Profit or loss in £2 |
4,601 |
3,117 |
1,633 |
-1,336 |
-2,078 |
-3,191 |
|
Profit or loss in C$2 |
8,494 |
5,754 |
3,014 |
-2,466 |
-3,836 |
-5,891 |
- 1.00 lot is equivalent of 100 units
- Calculations for exchange rate used as of 09:10 (GMT+1) 20/06/2025
There is a possibility to use Stop-Loss and Take-Profit.
- You may wish to consider closing your position in profit, even if it is lower than suggested one.
- Trailing stop technique could protect the profit.