SILVER
August 31, 2026
Risk Disclaimer: The example below is for illustrative purposes only and is based on price movements derived from Contracts for Difference (CFDs). The calculations reflect hypothetical outcomes using historical or specified price data for the relevant instrument on the stated date and are not indicative of future performance. Any reliance placed on this material is strictly at the user’s own risk.
Weekly Special Report: Silver
EVENTS:
- FRIDAY, SEPTEMBER 4 AT 13:30 GMT+1: U.S. NONFARM PAYROLLS (NFP) AND UNEMPLOYMENT RATE (AUGUST). Investors will closely watch the U.S. labor market after July’s very weak employment data, when nonfarm payrolls (NFP) fell by 23,000. Another weak report could reduce expectations of a Federal Reserve interest rate hike at the September meeting, weighing on the U.S. dollar and supporting silver prices.
- FRIDAY, SEPTEMBER 11 AT 13:30 GMT+1: U.S. INFLATION DATA (CPI) (AUGUST). Investors will closely watch U.S. inflation after the last two readings declined, from 4.2% in May to 3.5% in June and 3.4% in July. Another weak report could reduce expectations of a Federal Reserve interest rate hike at the September meeting, weighing on the U.S. dollar and supporting silver prices.
U.S. FEDERAL RESERVE (FED):
- WEDNESDAY, SEPTEMBER 16 AT 19:00 GMT+1: U.S. FEDERAL RESERVE (FED) INTEREST RATE DECISION. The Fed kept interest rates unchanged at 3.75% at its latest meeting and continued to downplay the likelihood of interest rate hikes in 2026. If the Fed maintains this position, it could weigh on the U.S. dollar and support silver prices.
U.S. GOVERNMENT:
- BREAKING (AUGUST 19): U.S. TREASURY ANNOUNCES STIMULUS-LIKE LONG-TERM BOND REPURCHASE PROGRAMME. The programme will start implementing on September 9, 2026. The US Treasury could use its near $1 trillion General Account (TGA) to help fund its announced plans to increase purchases of government bonds. The move could increase market liquidity, potentially weighing on the U.S. dollar and supporting silver prices.
SILVER MARKET: HIGHER DEMAND AMID SUPPLY SHORTAGES LEADS TO A WIDENING DEFICIT
- MARKET DEFICIT: SILVER MARKET REMAINS IN DEFICIT SINCE AT LEAST 2016. The silver market faced a deficit of around 300 million ounces in 2025, according to recent reports from The Silver Institute. While the market has been in deficit since 2016, the gap has grown significantly since 2022.
- SUPPLY CONSTRAINTS: SILVER PRODUCTION REMAINS AROUND 800 MILLION OUNCES PER YEAR. Annual production has held near 800 million ounces, remaining largely unchanged since 2016. There is no clear indication that output will be meaningfully higher in 2026 or the following years.
- DEMAND REMAINS STRONG: SOLAR PANELS, ELECTRIC VEHICLES, AND A.I. INFRASTRUCTURE. Silver demand could increase during 2026 and beyond due to rising demand from solar production, electric vehicles, and rapidly expanding A.I. data center infrastructure.
TECHNICAL ANALYSIS AND PRICE ACTION:
- SUPPORT AREA: $60 - $55. Since late 2025, silver has approached the $60 level multiple times, with each test followed by a rebound, highlighting the area's significance as a key support level. However, the price could also decline.
- SILVER PRICE HIT A NEW ALL-TIME HIGH ON JANUARY 29, 2026 ($121.49). Silver currently trades at $67.00, and if it fully recovers to its previous all-time high, it could see an upside of around 81%. However, the price could also decline.
- FORECAST: Bank of America forecasts $86; UBS forecasts $83; JPMorgan forecasts $85; Deutsche Bank forecasts $100; Goldman Sachs forecasts $86; Citigroup $90;
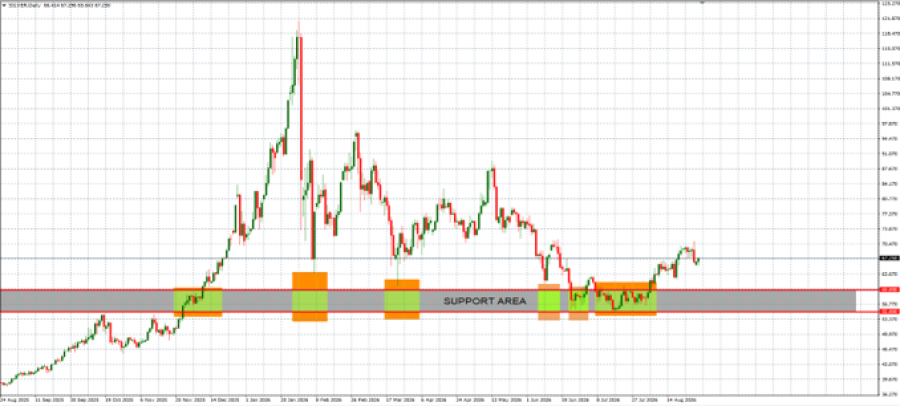
GRAPH (Daily): August 2025 - August 2026
Please note that past performance does not guarantee future results
Silver, August 31, 2026
Current Price: 67.00
|
SILVER |
Weekly |
|
Market Trend |
|
|
90 |
|
|
80 |
|
|
73 |
|
|
62 |
|
|
61 |
|
|
60 |
Example of calculation based on weekly market trend for 1.00 Lot1
|
SILVER |
||||||
|
Pivot Points |
||||||
|
Profit or loss in $ |
230,000 |
130,000 |
60,000 |
-50,000 |
-60,000 |
-70,000 |
|
Profit or loss in €² |
198,332 |
112,101 |
51,739 |
-43,116 |
-51,739 |
-60,362 |
|
Profit or loss in £² |
169,891 |
96,025 |
44,319 |
-36,933 |
-44,319 |
-51,706 |
|
Profit or loss in C$² |
319,355 |
180,505 |
83,310 |
-69,425 |
-83,310 |
-97,195 |
- The above calculations are made based on 1.00 lot which is equivalent of 10000 units
- Calculations for exchange rate used as of 12:30 (GMT+1) 31/8/2029
You can use risk management tools such as Stop-Loss and Take-Profit.


