GOLD
September 14, 2026
Risk Disclaimer: The example below is for illustrative purposes only and is based on price movements derived from Contracts for Difference (CFDs). The calculations reflect hypothetical outcomes using historical or specified price data for the relevant instrument on the stated date and are not indicative of future performance. Any reliance placed on this material is strictly at the user’s own risk.
Weekly Special Report: Gold
U.S. FEDERAL RESERVE:
- WEDNESDAY, SEPTEMBER 16 AT 19:00 GMT+1: U.S. FEDERAL RESERVE (FED) INTEREST RATE DECISION. The Fed interest rate currently stands at 3.75%, and many market participants expect an increase to 4%. However, if the Fed decides to keep rates unchanged at 3.75%, this could put negative pressure on the US dollar, supporting gold prices.
PRESS CONFERENCE (FED CHAIR KEVIN WARSH) AT 19:30 GMT+1. Investors will closely watch Warsh’s comments on inflation, the economy, and future interest rates. If Mr. Warsh continues to downplay the likelihood of future interest rate hikes, this could weigh on the US dollar and support gold prices.
EVENTS:
- WEDNESDAY, SEPTEMBER 16 AT 13:30 GMT+1: U.S. RETAIL SALES (AUGUST). Investors will closely watch Retail Sales after July's reading unexpectedly declined, raising concerns about slowing consumer spending. Another weak report could reduce expectations of Federal Reserve interest rate hikes, weighing on the U.S. dollar and supporting gold prices.
- THURSDAY, SEPTEMBER 17 AT 13:30 GMT+1: U.S. PHILADELPHIA FED MANUFACTURING INDEX (SEPTEMBER). A weaker-than-expected reading could reduce expectations of future Federal Reserve interest rate hikes, weighing on the U.S. dollar and supporting gold prices.
- THURSDAY, SEPTEMBER 17 AT 13:30 GMT+1: U.S. WEEKLY INITIAL JOBLESS CLAIMS. A higher-than-expected reading could indicate further weakness in the U.S. labor market, weighing on the U.S. dollar and supporting gold prices.
U.S. GOVERNMENT:
- BREAKING (SEPTEMBER 10): U.S. TREASURY TRIPLED LONG-TERM BOND BUYBACK TO $6 BILLION, WITH MORE BUYBACKS EXPECTED. The U.S. Treasury bought up to $6 billion of 10–20 year Treasury bonds, triple the size of its previous long-dated operation. Further larger buybacks are planned over the coming months, and the Treasury has a nearly $1 trillion General Account (TGA) that could help fund these operations. The programme could increase market liquidity, potentially weighing on the U.S. dollar and supporting gold prices.
CENTRAL BANKS:
- CHINA CONTINUES GOLD PURCHASES: China purchased gold for the 22nd consecutive month in August. The People's Bank of China added 650,000 ounces in August, which was the biggest monthly increase since October 2023.
- CHINA'S GOLD RESERVES CONTINUE TO RISE: China's official gold reserves rose from 76.08 million ounces in July to 76.73 million ounces in August 2026. China is now the fifth-largest official gold holder in the world.
- GLOBAL CENTRAL BANK DEMAND REMAINS STRONG: Central banks bought 289 tons of gold in Q2 2026, up 62% from the same period last year, showing continued strong demand for gold.
TECHNICAL ANALYSIS AND PRICE ACTION:
- SUPPORT AREA: $4,200–$4,100. After its recent decline, gold is approaching the key $4,200–$4,100 support area, where prices have repeatedly held or rebounded in the past. Holding above this area could support another recovery. However, prices could also decline.
- GOLD PRICE HIT A NEW ALL-TIME HIGH ON JANUARY 28, 2026 ($5,597.41). Gold price currently trades at around $4,290, and if it fully recovers to its previous all-time high, it could see an upside of around $1,307. However, the price could also decline.
- FORECAST: Wells Fargo forecasts $4,900; Bank of America forecasts $4,800; Goldman Sachs forecasts $4,900; Morgan Stanley forecasts $5,200; UBS forecasts $5,500; JPMorgan forecasts $6,000; Deutsche Bank forecasts $4,800; Citigroup forecasts $5,000; Societe General forecasts $6,000.
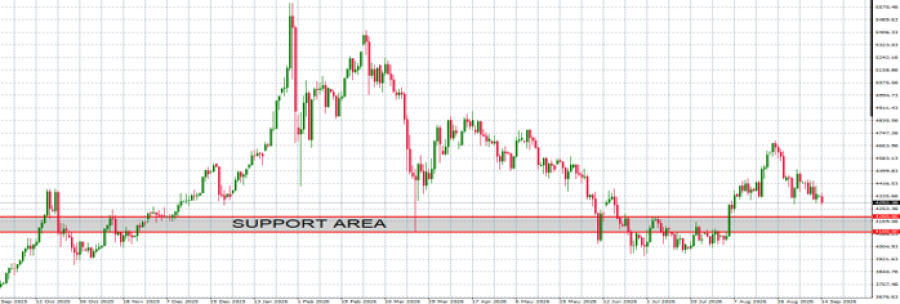 GRAPH (Daily): October 2025 – September 2026
Please note that past performance does not guarantee future results
Gold, September 14, 2026
Current Price: 4,290
|
GOLD |
Weekly |
|
Market Trend |
|
|
4,600 |
|
|
4,500 |
|
|
4,450 |
|
|
4,140 |
|
|
4,120 |
|
|
4,100 |
Example of calculation based on weekly market trend for 1.00 Lot1
|
GOLD |
||||||
|
Pivot Points |
||||||
|
Profit or loss in $ |
31,000 |
21,000 |
16,000 |
-15,000 |
-17,000 |
-19,000 |
|
Profit or loss in €² |
26,867 |
18,200 |
13,867 |
-13,000 |
-14,733 |
-16,467 |
|
Profit or loss in £² |
22,991 |
15,575 |
11,866 |
-11,125 |
-12,608 |
-14,091 |
|
Profit or loss in C$² |
43,084 |
29,186 |
22,237 |
-20,847 |
-23,627 |
-26,406 |
- The above calculations are made based on 1.00 lot which is equivalent of 100 units
- Calculations for exchange rate used as of 11:45 (GMT+1) 14/09/2026
You can use risk management tools such as Stop-Loss and Take-Profit.


