NATURAL GAS
August 25, 2026
Risk Disclaimer: The example below is for illustrative purposes only and is based on price movements derived from Contracts for Difference (CFDs). The calculations reflect hypothetical outcomes using historical or specified price data for the relevant instrument on the stated date and are not indicative of future performance. Any reliance placed on this material is strictly at the user’s own risk.
Weekly Special Report: Natural Gas
NATURAL GAS: USE AND MARKET SHARE
- NATURAL GAS is mainly used for electricity generation in the U.S. Natural gas power plants supplied roughly 42%–46% of U.S. electricity during recent summers, largely because of air conditioning demand.
- MARKET SHARE (PRODUCERS): BIGGEST NATURAL GAS PRODUCERS IN THE WORLD. The U.S. is the largest producer, accounting for around 25% of global natural gas production, while Russia ranks second with about 15%. Qatar contributes roughly 4–5%, while Iran accounts for approximately 6-7% of total global production.
- MARKET SHARE (TOTAL NATURAL GAS + LNG IMPORTERS): China is the world’s largest importer, accounting for approximately 20% of global imports, followed by Japan with around 16–18%. The European Union represents the largest bloc, accounting for roughly 27% of total natural gas imports.
Sources: EIA
GEOPOLITICS: MIDDLE EAST WAR
- BREAKING (AUGUST 24): U.S. ANNOUNCES NEW SANCTIONS AGAINST IRAN AS MIDDLE EAST TENSIONS REMAIN HIGH. The U.S. announced sanctions targeting around 60 individuals, companies and vessels linked to Iran’s oil, shipping, financial and military networks. The measures aim to reduce Iran’s foreign revenues and increase pressure on Tehran.
- BREAKING (AUGUST 25): STRAIT OF HORMUZ TRAFFIC REMAINS BELOW NORMAL LEVELS. Since Iran closed the strait on July 11, shipping has remained well below normal levels. Iran says it will not fully reopen the strait unless the U.S. meets several demands, including lifting sanctions, paying compensation and ending military threats.
- QATAR, WHICH ACCOUNTS FOR AROUND 20% OF GLOBAL LNG (Liquified Natural Gas) EXPORTS, REMAINS EXPOSED TO THE STRAIT OF HORMUZ RISK, as a large share of its LNG shipments passes through the route. Any further escalation or disruption to shipping could significantly impact global LNG supplies and natural gas prices.
Sources: Bloomberg, Reuters
EUROPE: NATURAL GAS STORAGE REFILLING SEASON IS UNDERWAY
- EU STORAGE LEVELS AT AROUND 62.99% FULL, UP FROM AROUND 35% IN EARLY APRIL. European natural gas storage levels continue to rise as the seasonal refilling period remains underway, with inventories increasing significantly from early April. Europe purchases more than 50% of its LNG imports from the USA.
- U.S. LNG DEMAND EXPECTED TO INCREASE. As summer maintenance at major U.S. LNG export facilities comes to an end, feedgas demand is expected to recover. Lower European storage levels could maintain strong demand for U.S. LNG, supporting U.S. natural gas prices.
U.S. WEATHER FORECASTS
- U.S. NOAA (National Weather Service) FORECASTS HOT AND ABOVE-AVERAGE TEMPERATURES ACROSS MOST OF THE USA INTO EARLY SEPTEMBER. The U.S. NOAA National Weather Service forecasts hot and, in many areas, above-average temperatures across most of the United States during August. Hot weather is expected to increase air conditioning use, which, in turn, could boost electricity and natural gas demand and consumption.
TECHNICAL ANALYSIS
- SUPPORT AREA: $3.00 - $2.70. Natural gas prices have maintained a key support zone between $3.00 and $2.70 since October 2024. Prices have repeatedly rebounded from or near this range, reinforcing it as an important technical level. Natural gas is currently trading within this support area, and another rebound could support a recovery in prices. However, a sustained break below this zone could indicate further downside risk.
- BREAKING (AUGUST 6): NATURAL GAS PRICES HIT ITS LOWEST LEVELS IN MORE THAN 3 MONTHS ($2.613)
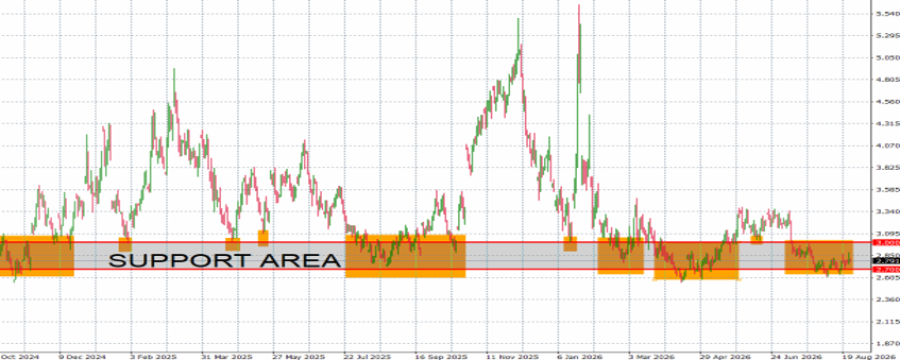
GRAPH (Daily): October 2024 - August 2026
Please note that past performance does not guarantee future results
Natural Gas, August 25, 2026
Current Price: 2.790
|
NATURAL GAS |
Weekly |
|
Market Trend |
|
|
3.500 |
|
|
3.200 |
|
|
3.000 |
|
|
2.600 |
|
|
2.575 |
|
|
2.550 |
Example of calculation based on weekly market trend for 1.00 Lot1
|
NATURAL GAS |
||||||
|
Pivot Points |
||||||
|
Profit or loss in $ |
7,100 |
4,100 |
2,100 |
-1,900 |
-2,150 |
-2,400 |
|
Profit or loss in €² |
6,085 |
3,514 |
1,800 |
-1,628 |
-1,843 |
-2,057 |
|
Profit or loss in £² |
5,204 |
3,005 |
1,539 |
-1,393 |
-1,576 |
-1,759 |
|
Profit or loss in C$² |
9,840 |
5,682 |
2,911 |
-2,633 |
-2,980 |
-3,326 |
- The above calculations are made based on 1.00 lot which is equivalent of 10,000 units
- Calculations for exchange rate used as of 09:40 (GMT+1) 25/08/2026
You can use risk management tools such as Stop-Loss and Take-Profit.


