CFDs are complex instruments and come with a high risk of losing money rapidly due to leverage. 71% of retail investor accounts lose money when trading CFDs with this provider. You should consider whether you understand how CFDs work and whether you can afford to take the high risk of losing your money.
CFDs are complex instruments and come with a high risk of losing money rapidly due to leverage. 70.91% of retail investor accounts lose money when trading CFDs with this provider. You should consider whether you understand how CFDs work and whether you can afford to take the high risk of losing all your money. Read full risk warning.

Crude Oil Analysis

US Session Analysis for CFD Instruments 02/11/2021

Fundamental analysis

02 November, 2021

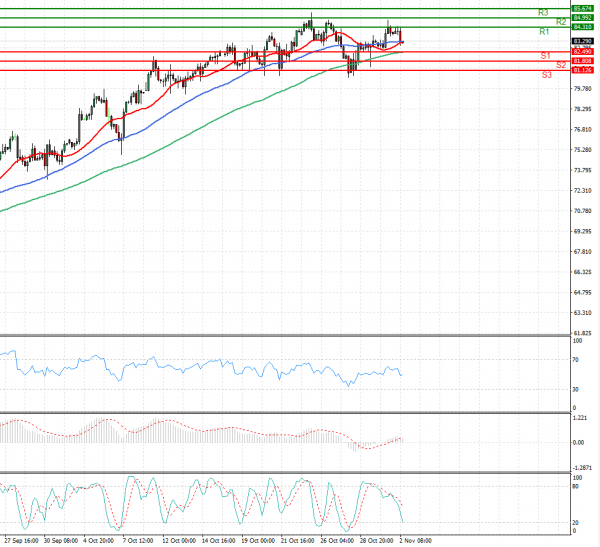
Oil rose towards $85 a barrel on Tuesday, not far from a multi-year high, supported by signs that supply from OPEC and other producers is falling short as demand recovers from the worst of the pandemic. The increase in OPEC’s oil output in October undershot the rise planned under a deal with allies, a Reuters survey found on Monday, due to involuntary outages and limited capacity in some smaller producers. OPEC+, which cut output by 9.7 million barrels per day or about 10% of daily demand in 2020, has been sticking to gradual, monthly production increases of 400,000 bpd, despite calls for more from the United States and other consumers. The alliance is expected to do just that at its next meeting, scheduled for Thursday. Limiting the gain in prices were expectations this week’s snapshot of U.S. supply will show another rise in crude inventories. Analysts in a Reuters poll see an increase of 1.6 million barrels.

Technical analysis

Crude Oil Analysis Technical analysis 02/11/2021
Time Frame: 1 hour

CRUDEOIL Support & Resistance Table - 02/11/2021

Support & Resistance Level Explanation
Resistance 2 84.992 Daily R2
Resistance 1 84.310 Daily R1
Support 1 82.490 Daily S1
Support 2 81.808 Daily S2

CRUDEOIL Indicator Table - 02/11/2021

Indicator Signal
SMA 20 Buy
SMA 50 Buy
SMA 100 Buy
MACD( 12;26;9) Buy
RSI (14) Buy
Stochastic ( 9;6;3) Sell

CRUDEOIL Indicator / Period Table - 02/11/2021

Indicator / Period Day - BuyWeek - BuyMonth - Buy
MACD( 12;26;9) Buy BuyBuy
RSI (14) Buy BuyBuy
SMA 20 Buy BuyBuy

CRUDEOIL 02/11/2021 - Reference Price : 83.400

Buy
Simple Moving AverageBuy (3)Sell (0)
Technical Indicators - OscillatorsBuy (2)Sell (0)
Share It With Your Network
Crude OIL Chart
Update Time: -
Highest
Lowest
1M 5M H D W
Prices are loading..
Ready for trading?Start Now