Fortrade Canada Ltd. as an order-execution only dealer is not permitted to provide you with any advice or recommendations. These Market Commentaries should not be construed as a recommendation, advice or any attempt by Fortrade Canada Ltd. to prompt or influence you in making an investment decision to purchase, sell, hold or exchange any security or to influence the timing of such activity. This content is produced by Fortrade Limited which is not registered in any capacity with any securities regulatory authority in Canada.
71% of retail investor accounts lose money when trading CFDs with this provider.
CFDs are complex instruments and come with a high risk of losing money rapidly due to leverage. 71% of retail investor accounts lose money when trading CFDs with this provider. You should consider whether you understand how CFDs work and whether you can afford to take the high risk of losing your money.
70.41% of retail investor accounts lose money when trading CFDs with this provider.
CFDs are complex instruments and come with a high risk of losing money rapidly due to leverage. 70.41% of retail investor accounts lose money when trading CFDs with this provider. You should consider whether you understand how CFDs work and whether you can afford to take the high risk of losing all your money. Read full risk warning.
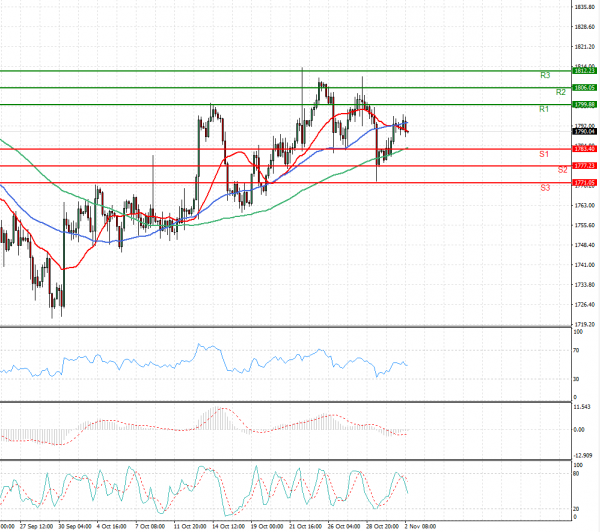
US Session Analysis for CFD Instruments 02/11/2021
Fundamental analysis
02 November, 2021
Gold prices held steady on Tuesday ahead of a crucial U.S. Federal Reserve meeting that is likely to offer cues on future interest rate hikes amid rising inflationary pressures. While gold is used as a hedge against inflation, reduced stimulus and interest rate hikes tend to push government bond yields up, raising non-yielding bullion’s opportunity cost. The Fed is expected to approve plans to scale back its bond-buying programme on Wednesday, when it concludes its two-day policy meeting. Markets will also be watching the Bank of England policy meeting on Thursday as investors weigh chances of the first interest rate hike by a major central bank since the pandemic.