Fortrade Canada Ltd. as an order-execution only dealer is not permitted to provide you with any advice or recommendations. These Market Commentaries should not be construed as a recommendation, advice or any attempt by Fortrade Canada Ltd. to prompt or influence you in making an investment decision to purchase, sell, hold or exchange any security or to influence the timing of such activity. This content is produced by Fortrade Limited which is not registered in any capacity with any securities regulatory authority in Canada.
71% of retail investor accounts lose money when trading CFDs with this provider.
CFDs are complex instruments and come with a high risk of losing money rapidly due to leverage. 71% of retail investor accounts lose money when trading CFDs with this provider. You should consider whether you understand how CFDs work and whether you can afford to take the high risk of losing your money.
70.41% of retail investor accounts lose money when trading CFDs with this provider.
CFDs are complex instruments and come with a high risk of losing money rapidly due to leverage. 70.41% of retail investor accounts lose money when trading CFDs with this provider. You should consider whether you understand how CFDs work and whether you can afford to take the high risk of losing all your money. Read full risk warning.
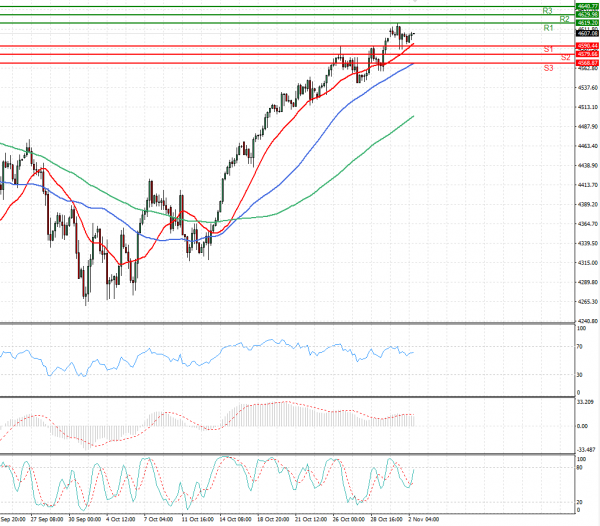
US Session Analysis for CFD Instruments 02/11/2021
Fundamental analysis
02 November, 2021
U.S. stock futures paused after all three major indexes closed at record highs, as the Federal Reserve was set to begin its two-day policy meeting against a backdrop of sharpening inflation concerns. Futures tied to the S&P 500 wavered between small gains and losses Tuesday. Futures tied to the Dow Jones Industrial Average and the Nasdaq-100 lost 0.1%, a day after the blue-chip index briefly jumped above the 36000 level for the first time. The Fed’s two-day policy meeting will be a key focus of investors this week who have grown increasingly concerned that a period of rising prices could last longer and weigh more on the economy than central bank officials have suggested. Major central banks elsewhere in the world, concerned about stubbornly high inflation, have been moving forward plans to raise rates.