CFDs are complex instruments and come with a high risk of losing money rapidly due to leverage. 71% of retail investor accounts lose money when trading CFDs with this provider. You should consider whether you understand how CFDs work and whether you can afford to take the high risk of losing your money.
CFDs are complex instruments and come with a high risk of losing money rapidly due to leverage. 70.91% of retail investor accounts lose money when trading CFDs with this provider. You should consider whether you understand how CFDs work and whether you can afford to take the high risk of losing all your money. Read full risk warning.

Gold - Usd Dollar Analysis

US Session Analysis for CFD Instruments 27/05/2022

Fundamental analysis

27 May, 2022

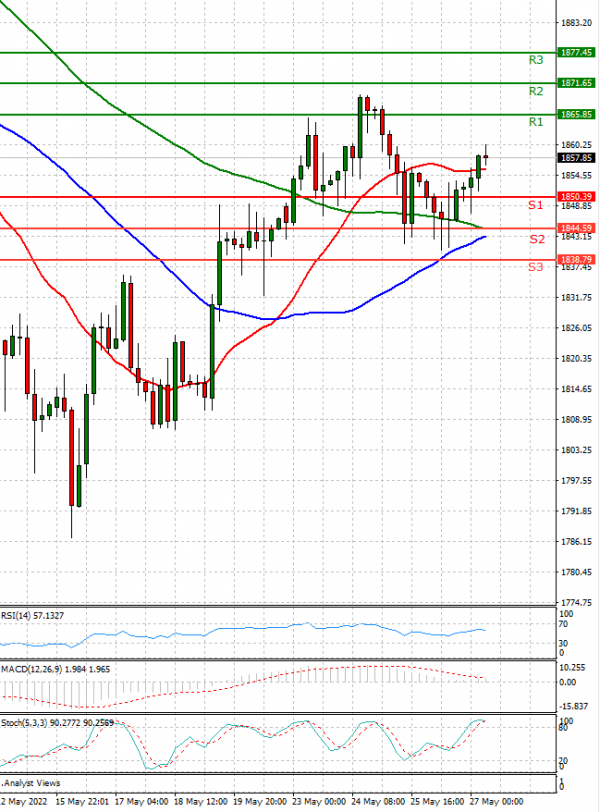
During most of European trade, the price of gold fell. The first reading of the US GDP for the first quarter, showed a gloomier picture of the state of the US economy. Also, the day before yesterday, the notes from the last meeting of the Fed showed a slightly milder hawkish tone. This helped the gold to continue its slight upward trend. Price inflation in the United States, the Eurozone, the United Kingdom and Canada, as well as Turkey and Brazil, indicates that it will remain a reality for a long time, which supports the price of the precious metal in the long run. From the point of view of technical analysis, gold was resold and a strong rebound from the 1800 level followed which continues. At around 13:20, the price of gold is trading at around 1858.5 dollars per fine ounce, which represents a price increase of 0.3% since the beginning of trading tonight. At 14:30, the personal consumption (inflation) index (PCE) will be published in the USA in April, which follows the Fed in conducting its monetary policy.

Technical analysis

Gold - Usd Dollar Analysis Technical analysis 27/05/2022
Time Frame: 1 hour

GOLD Support & Resistance Table - 27/05/2022

Support & Resistance Level Explanation
Resistance 2 1871.65 Daily R2
Resistance 1 1865.85 Daily R1
Support 1 1850.39 Daily S1
Support 2 1844.59 Daily S2

GOLD Indicator Table - 27/05/2022

Indicator Signal
SMA 20 Neutral
SMA 50 Buy
SMA 100 Buy
MACD( 12;26;9) Buy
RSI (14) Buy
Stochastic ( 9;6;3) Buy

GOLD Indicator / Period Table - 27/05/2022

Indicator / Period Day - BuyWeek - SellMonth - Sell
MACD( 12;26;9) Buy SellBuy
RSI (14) Buy BuySell
SMA 20 Neutral BuySell

GOLD 27/05/2022 - Reference Price : 1858.12

Buy
Simple Moving AverageBuy (2)Sell (0)
Technical Indicators - OscillatorsBuy (3)Sell (0)
Share It With Your Network
GOLD Chart
Update Time: -
Highest
Lowest
1M 5M H D W
Prices are loading..
Ready for trading?Start Now