CFDs are complex instruments and come with a high risk of losing money rapidly due to leverage. 71% of retail investor accounts lose money when trading CFDs with this provider. You should consider whether you understand how CFDs work and whether you can afford to take the high risk of losing your money.
CFDs are complex instruments and come with a high risk of losing money rapidly due to leverage. 70.41% of retail investor accounts lose money when trading CFDs with this provider. You should consider whether you understand how CFDs work and whether you can afford to take the high risk of losing all your money. Read full risk warning.

Gold - Usd Dollar Analysis

US Session Analysis for CFD Instruments 20/05/2024

Fundamental analysis

20 May, 2024

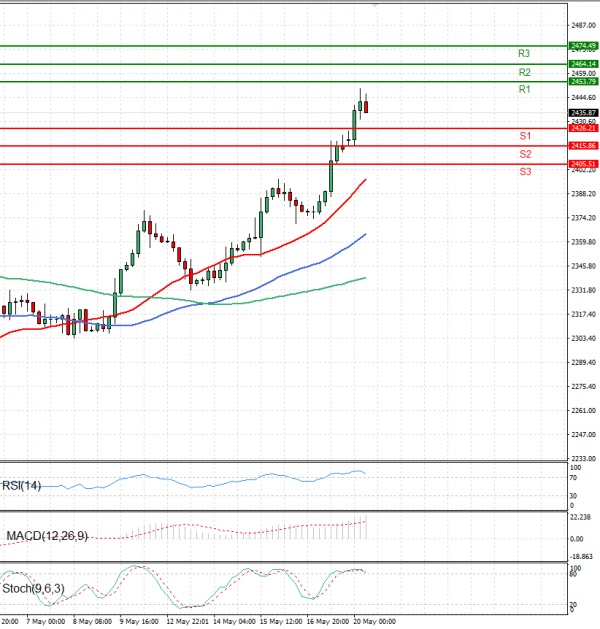
Gold prices are trading in today’s European session above 2440 levels.

Gold prices reached a record high in European trading on Monday, driven by heightened geopolitical tensions in the Middle East, which bolstered safe-haven demand, along with a broader rally in metal markets. The stability of the region came under scrutiny following a helicopter crash involving Iranian President Ebrahim Raisi and his foreign minister amid bad weather on Sunday.

Back in April, gold prices had surged to record levels due to fears of a potential war between Israel and Iran, though such a conflict did not materialise. However, the current threat of further instability in the Middle East is once again supporting the yellow metal.

Tensions remain elevated as Israel continues its strikes against Gaza. Additionally, increased military action between Russia and Ukraine over the weekend also fueled safe-haven demand, with both countries launching strikes against each other.

Technical analysis

Gold - Usd Dollar Analysis Technical analysis 20/05/2024
Time Frame: 1 hour

GOLD Support & Resistance Table - 20/05/2024

Support & Resistance Level Explanation
Resistance 2 2464.14 Daily R2
Resistance 1 2453.79 Daily R1
Support 1 2426.21 Daily S1
Support 2 2415.86 Daily S2

GOLD Indicator Table - 20/05/2024

Indicator Signal
SMA 20 Buy
SMA 50 Buy
SMA 100 Buy
MACD( 12;26;9) Buy
RSI (14) Sell
Stochastic ( 9;6;3) Sell

GOLD Indicator / Period Table - 20/05/2024

Indicator / Period Day - BuyWeek - BuyMonth - Buy
MACD( 12;26;9) Buy BuyBuy
RSI (14) Sell BuyBuy
SMA 20 Buy BuyBuy

GOLD 20/05/2024 - Reference Price : 2435.87

Buy
Simple Moving AverageBuy (3)Sell (0)
Technical Indicators - OscillatorsBuy (1)Sell (2)
Share It With Your Network
GOLD Chart
Update Time: -
Highest
Lowest
1M 5M H D W
Prices are loading..
Ready for trading?Start Now