77% of retail investor accounts lose money when trading CFDs with this provider.
CFDs are complex instruments and come with a high risk of losing money rapidly due to leverage. 77% of retail investor accounts lose money when trading CFDs with this provider. You should consider whether you understand how CFDs work and whether you can afford to take the high risk of losing your money.
76% of retail investor accounts lose money when trading CFDs with this provider.
CFDs are complex instruments and come with a high risk of losing money rapidly due to leverage. 76% of retail investor accounts lose money when trading CFDs with this provider. You should consider whether you can afford to take the high risk of losing your money.
US Session Analysis for CFD Instruments 17/09/2021
Fundamental analysis
17 September, 2021
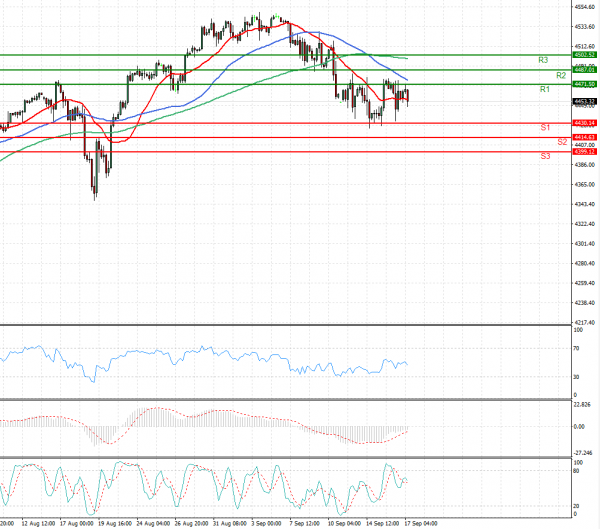
U.S. stock futures edged up ahead of fresh data on consumer sentiment, pointing to a subdued end to a choppy week in markets. Futures tied to the S&P 500 edged up less than 0.1%, pointing to a tepid finish for the broad-market index that has gained 0.3% this week so far. Nasdaq-100 futures were relatively flat, while Dow Jones Industrial Average futures climbed 0.1%.