The Aussie Dollar currency pair traded higher, moving to around 0.7269 levels during the Asian session. The Aussie Dollar traded sharply higher on Friday, helped by rising commodity prices. Australia’s Home Loans fell 6.6%, Month-over-Month. Its Manufacturing PMI for September printed at 56.8. Australia’s Commodity Prices rose 37.4%, Year-over-Year. In the United States, the Core PCE Price Index for August rose 0.3%, Month-over-Month. The consensus forecast was 0.2%. U.S. personal Spending for August was up 0.8%, Month-over-Month. Analysts had expected an increase of only 0.6%. The U.S. ISM Manufacturing PMI for September came in at 61.1, above the 59.6 that had been predicted.
Australian Dollar - Dollar Analysis
EU Session Analysis for CFD Instruments 04/10/2021
Technical analysis
Time Frame: 1 hour
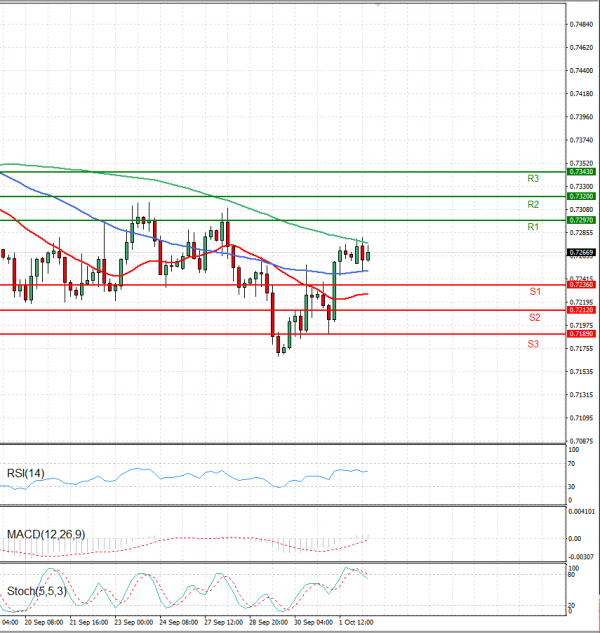
AUDUSD Support & Resistance Table - 04/10/2021
| Support & Resistance | Level | Explanation |
| Resistance 2 | 0.7320 | Daily R2 |
| Resistance 1 | 0.7297 | Daily R1 |
| Support 1 | 0.7236 | Daily S1 |
| Support 2 | 0.7212 | Daily S2 |
AUDUSD Indicator Table - 04/10/2021
| Indicator | Signal |
| SMA 20 | Buy |
| SMA 50 | Buy |
| SMA 100 | Sell |
| MACD( 12;26;9) | Neutral |
| RSI (14) | Buy |
| Stochastic ( 9;6;3) | Sell |
AUDUSD Indicator / Period Table - 04/10/2021
| Indicator / Period | Day - Buy | Week - Sell | Month - Buy |
| MACD( 12;26;9) | Neutral | Sell | Buy |
| RSI (14) | Buy | Sell | Neutral |
| SMA 20 | Buy | Sell | Buy |
AUDUSD 04/10/2021 - Reference Price : 0.7267
| Buy |
|
Ready for trading?Start Now