Fortrade Canada Ltd. as an order-execution only dealer is not permitted to provide you with any advice or recommendations. These Market Commentaries should not be construed as a recommendation, advice or any attempt by Fortrade Canada Ltd. to prompt or influence you in making an investment decision to purchase, sell, hold or exchange any security or to influence the timing of such activity. This content is produced by Fortrade Limited which is not registered in any capacity with any securities regulatory authority in Canada.
69% of retail investor accounts lose money when trading CFDs with this provider.
CFDs are complex instruments and come with a high risk of losing money rapidly due to leverage. 69% of retail investor accounts lose money when trading CFDs with this provider. You should consider whether you understand how CFDs work and whether you can afford to take the high risk of losing your money.
67.52% of retail investor accounts lose money when trading CFDs with this provider.
CFDs are complex instruments and come with a high risk of losing money rapidly due to leverage. 67.52% of retail investor accounts lose money when trading CFDs with this provider. You should consider whether you understand how CFDs work and whether you can afford to take the high risk of losing all your money. Read full risk warning.
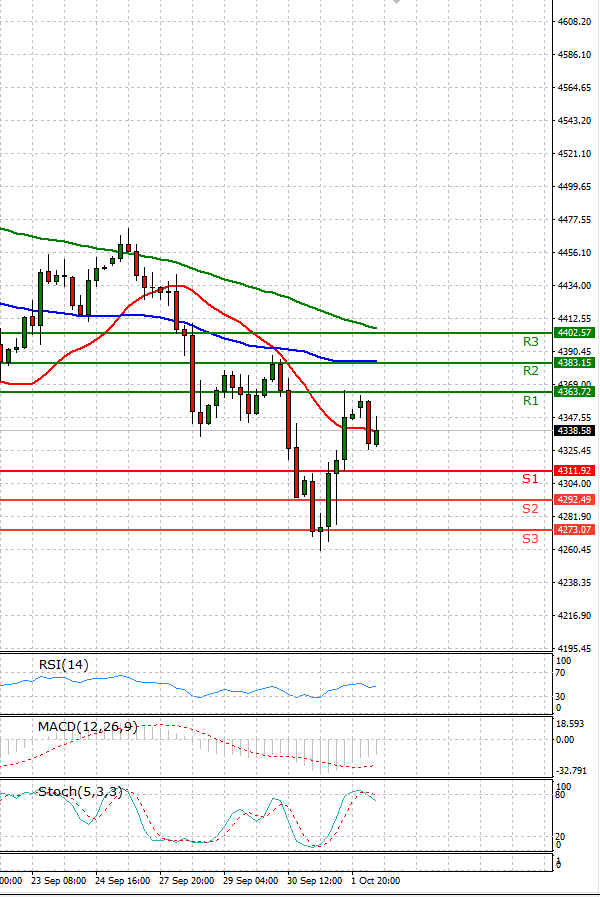
EU Session Analysis for CFD Instruments 04/10/2021
Fundamental analysis
04 October, 2021
Wall Street stocks surged to a higher close on Friday, kicking off the fourth quarter in a buying mood boosted by positive economic data, progress in the battle against COVID, and Washington developments on the potential passage of an infrastructure bill. The rally gained momentum after the White House announced U.S. President Joe Biden was getting more involved in negotiations over the infrastructure spending bill being debated on Capitol Hill. Merck & Co Inc revealed that a recent study showed its experimental oral drug for COVID-19 cut risk of death and hospitalization by about 50%, sending its shares jumping and boosting economic reopening sentiment. The sector’s gains were capped by a drop in shares of COVID vaccine maker Moderna Inc in the wake of the Merck news.