Fortrade Canada Ltd. as an order-execution only dealer is not permitted to provide you with any advice or recommendations. These Market Commentaries should not be construed as a recommendation, advice or any attempt by Fortrade Canada Ltd. to prompt or influence you in making an investment decision to purchase, sell, hold or exchange any security or to influence the timing of such activity. This content is produced by Fortrade Limited which is not registered in any capacity with any securities regulatory authority in Canada.
71% of retail investor accounts lose money when trading CFDs with this provider.
CFDs are complex instruments and come with a high risk of losing money rapidly due to leverage. 71% of retail investor accounts lose money when trading CFDs with this provider. You should consider whether you understand how CFDs work and whether you can afford to take the high risk of losing your money.
70.41% of retail investor accounts lose money when trading CFDs with this provider.
CFDs are complex instruments and come with a high risk of losing money rapidly due to leverage. 70.41% of retail investor accounts lose money when trading CFDs with this provider. You should consider whether you understand how CFDs work and whether you can afford to take the high risk of losing all your money. Read full risk warning.
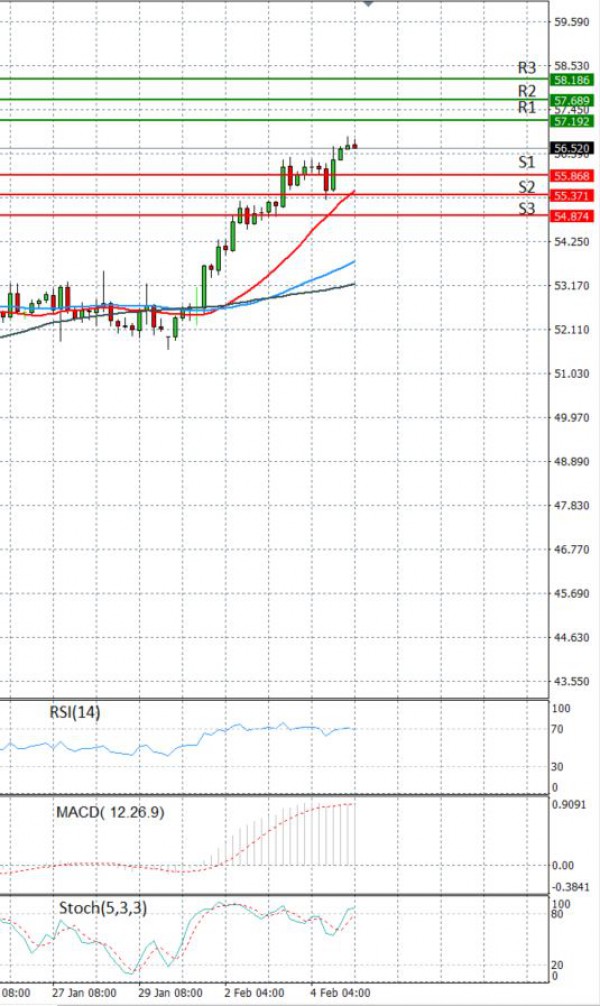
EU Session Analysis for CFD Instruments 05/02/2021
Fundamental analysis
05 February, 2021
Oil prices climbed on Friday to their highest levels in a year, extending a run of strong gains on signs of economic growth in the United States and a continued commitment by producers to hold back crude supply. The benchmark contract is on track for a weekly gain of nearly 9%, which would be its biggest weekly gain since October. Markets were encouraged by stronger-than-expected orders for U.S. goods in December, pointing to strength in manufacturing, and hopes for swift approval by lawmakers of President Joe Biden’s proposed $1.9 trillion coronavirus aid plan. Chinese demand for crude oil is also helping support the market, as shown by industry tracking that reports two tankers of North Sea crude oil heading to China for March 22 and March 24. Crude Oil prices moved sideways for the most part on Thursday, despite a momentary dip and bounce late in the trading day. Traders are balancing increasing demand due to vaccine rollouts and a well disciplined OPEC+ against the downside of further lockdowns.