Fortrade Canada Ltd. as an order-execution only dealer is not permitted to provide you with any advice or recommendations. These Market Commentaries should not be construed as a recommendation, advice or any attempt by Fortrade Canada Ltd. to prompt or influence you in making an investment decision to purchase, sell, hold or exchange any security or to influence the timing of such activity. This content is produced by Fortrade Limited which is not registered in any capacity with any securities regulatory authority in Canada.
71% of retail investor accounts lose money when trading CFDs with this provider.
CFDs are complex instruments and come with a high risk of losing money rapidly due to leverage. 71% of retail investor accounts lose money when trading CFDs with this provider. You should consider whether you understand how CFDs work and whether you can afford to take the high risk of losing your money.
70.41% of retail investor accounts lose money when trading CFDs with this provider.
CFDs are complex instruments and come with a high risk of losing money rapidly due to leverage. 70.41% of retail investor accounts lose money when trading CFDs with this provider. You should consider whether you understand how CFDs work and whether you can afford to take the high risk of losing all your money. Read full risk warning.
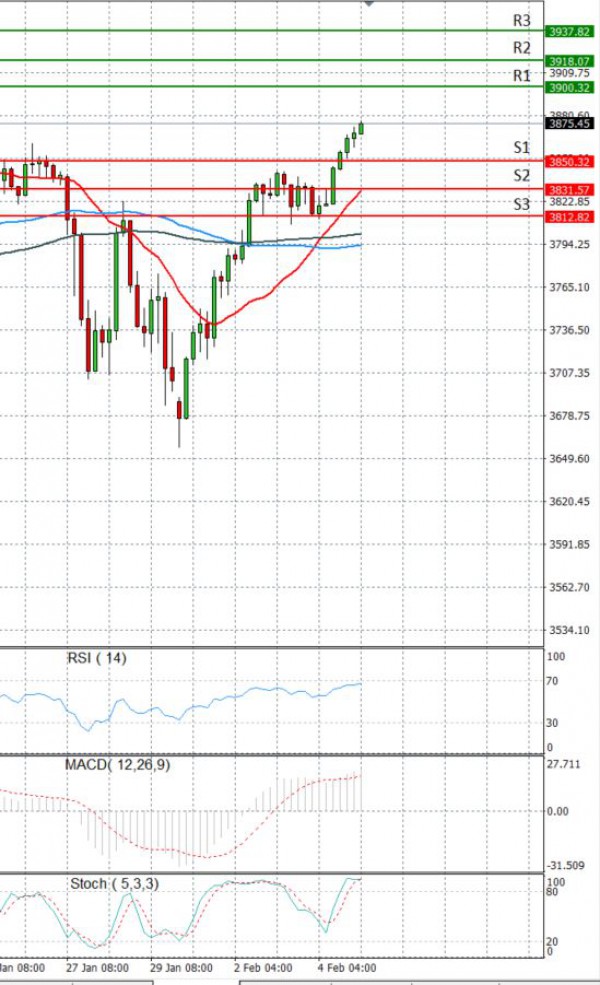
EU Session Analysis for CFD Instruments 05/02/2021
Fundamental analysis
05 February, 2021
U.S. stocks ended solidly higher on Thursday and the S&P 500 and Nasdaq posted record closing highs after another batch of upbeat earnings and data suggesting the labor market may be stabilizing. The Dow and S&P 500 rose for a fourth straight day, with investor hopes of further progress on a pandemic-relief package also boosting the market. Democrats in the U.S. Senate were poised on Thursday to take a first step toward the ultimate passage of President Joe Biden’s $1.9 trillion COVID-19 relief proposal. The number of Americans filing new applications for unemployment benefits decreased further last week, according to the Labor Department’s report. Stronger-than-expected results so far in the fourth quarter have driven up analysts’ expectations, and S&P 500 companies are now on track to post earnings growth for the quarter instead of a decline as initially expected. A pandemic-driven surge in online shopping during the holiday season helped e-commerce firm eBay Inc and payment platform PayPal Holdings Inc top quarterly earnings estimates.