CFDs are complex instruments and come with a high risk of losing money rapidly due to leverage. 71% of retail investor accounts lose money when trading CFDs with this provider. You should consider whether you understand how CFDs work and whether you can afford to take the high risk of losing your money.
CFDs are complex instruments and come with a high risk of losing money rapidly due to leverage. 70.91% of retail investor accounts lose money when trading CFDs with this provider. You should consider whether you understand how CFDs work and whether you can afford to take the high risk of losing all your money. Read full risk warning.

Crude Oil Analysis

EU Session Analysis for CFD Instruments 08/04/2021

Fundamental analysis

08 April, 2021

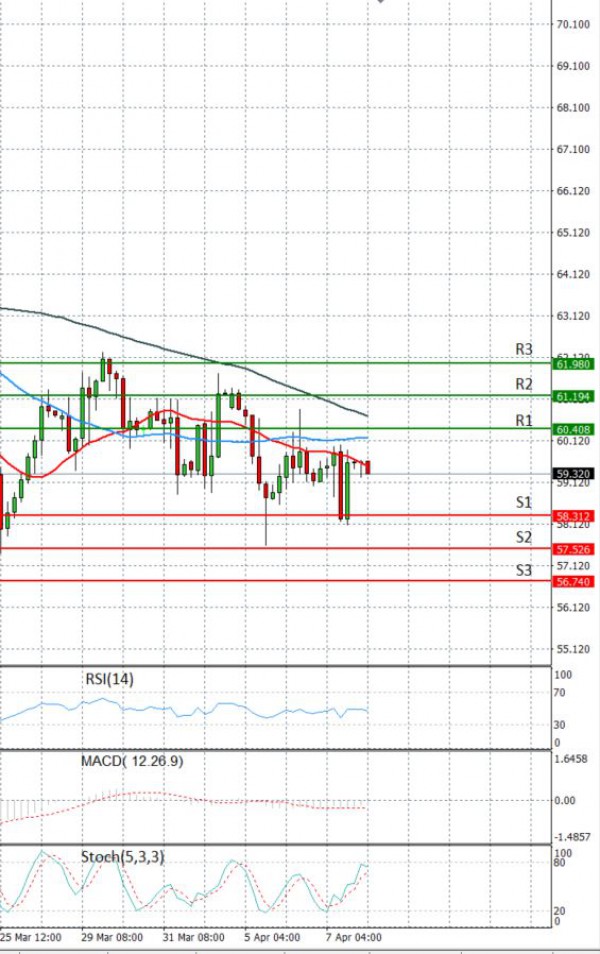
Oil prices fell on Thursday after official figures showed a big increase in U.S. gasoline stocks, causing concerns about demand for crude weakening in the world’s biggest consumer of the resource at a time when supplies around the world are rising. Oil inventories dropped by 3.5 million barrels last week to nearly 502 million barrels, while gasoline stocks increased by 4 million barrels, against expectations of a decline, to just over 230 million barrels, as refiners ramped up production before the summer driving season.Iran may see some sanctions lifted and add to global supplies, with the U.S. and other powers holding talks on reviving a nuclear deal that almost stopped Iranian oil from coming to market. Still, the International Monetary Fund said earlier this week that the massive public spending deployed to combat the COVID-19 pandemic may increase global growth to 6% this year, a rate not achieved since the 1970s. Higher economic growth would boost demand for oil and its products, helping to reduce stockpiles. Crude Oil bounced lower and recovered on Wednesday.

Technical analysis

Crude Oil Analysis Technical analysis 08/04/2021
Time Frame: 1 hour

CRUDEOIL Support & Resistance Table - 08/04/2021

Support & Resistance Level Explanation
Resistance 2 61.194 Daily R2
Resistance 1 60.408 Daily R1
Support 1 58.312 Daily S1
Support 2 57.526 Daily S2

CRUDEOIL Indicator Table - 08/04/2021

Indicator Signal
SMA 20 Sell
SMA 50 Sell
SMA 100 Sell
MACD( 12;26;9) Sell
RSI (14) Sell
Stochastic ( 9;6;3) Buy

CRUDEOIL Indicator / Period Table - 08/04/2021

Indicator / Period Day - SellWeek - SellMonth - Buy
MACD( 12;26;9) Sell SellBuy
RSI (14) Sell SellBuy
SMA 20 Sell SellBuy

CRUDEOIL 08/04/2021 - Reference Price : 59.360

Sell
Simple Moving AverageBuy (0)Sell (3)
Technical Indicators - OscillatorsBuy (1)Sell (2)
Share It With Your Network
Crude OIL Chart
Update Time: -
Highest
Lowest
1M 5M H D W
Prices are loading..
Ready for trading?Start Now